
Korea Short-term Energy Outlook
Research • Publications
-
2025 Korea Energy Outlook (2024, Second Half)
- Date2025/02/10
- Author Department of Energy Supply Statistics Research
- Number of downloads 23
-
Download multiple files Download the entire file
Energy Consumption Trends
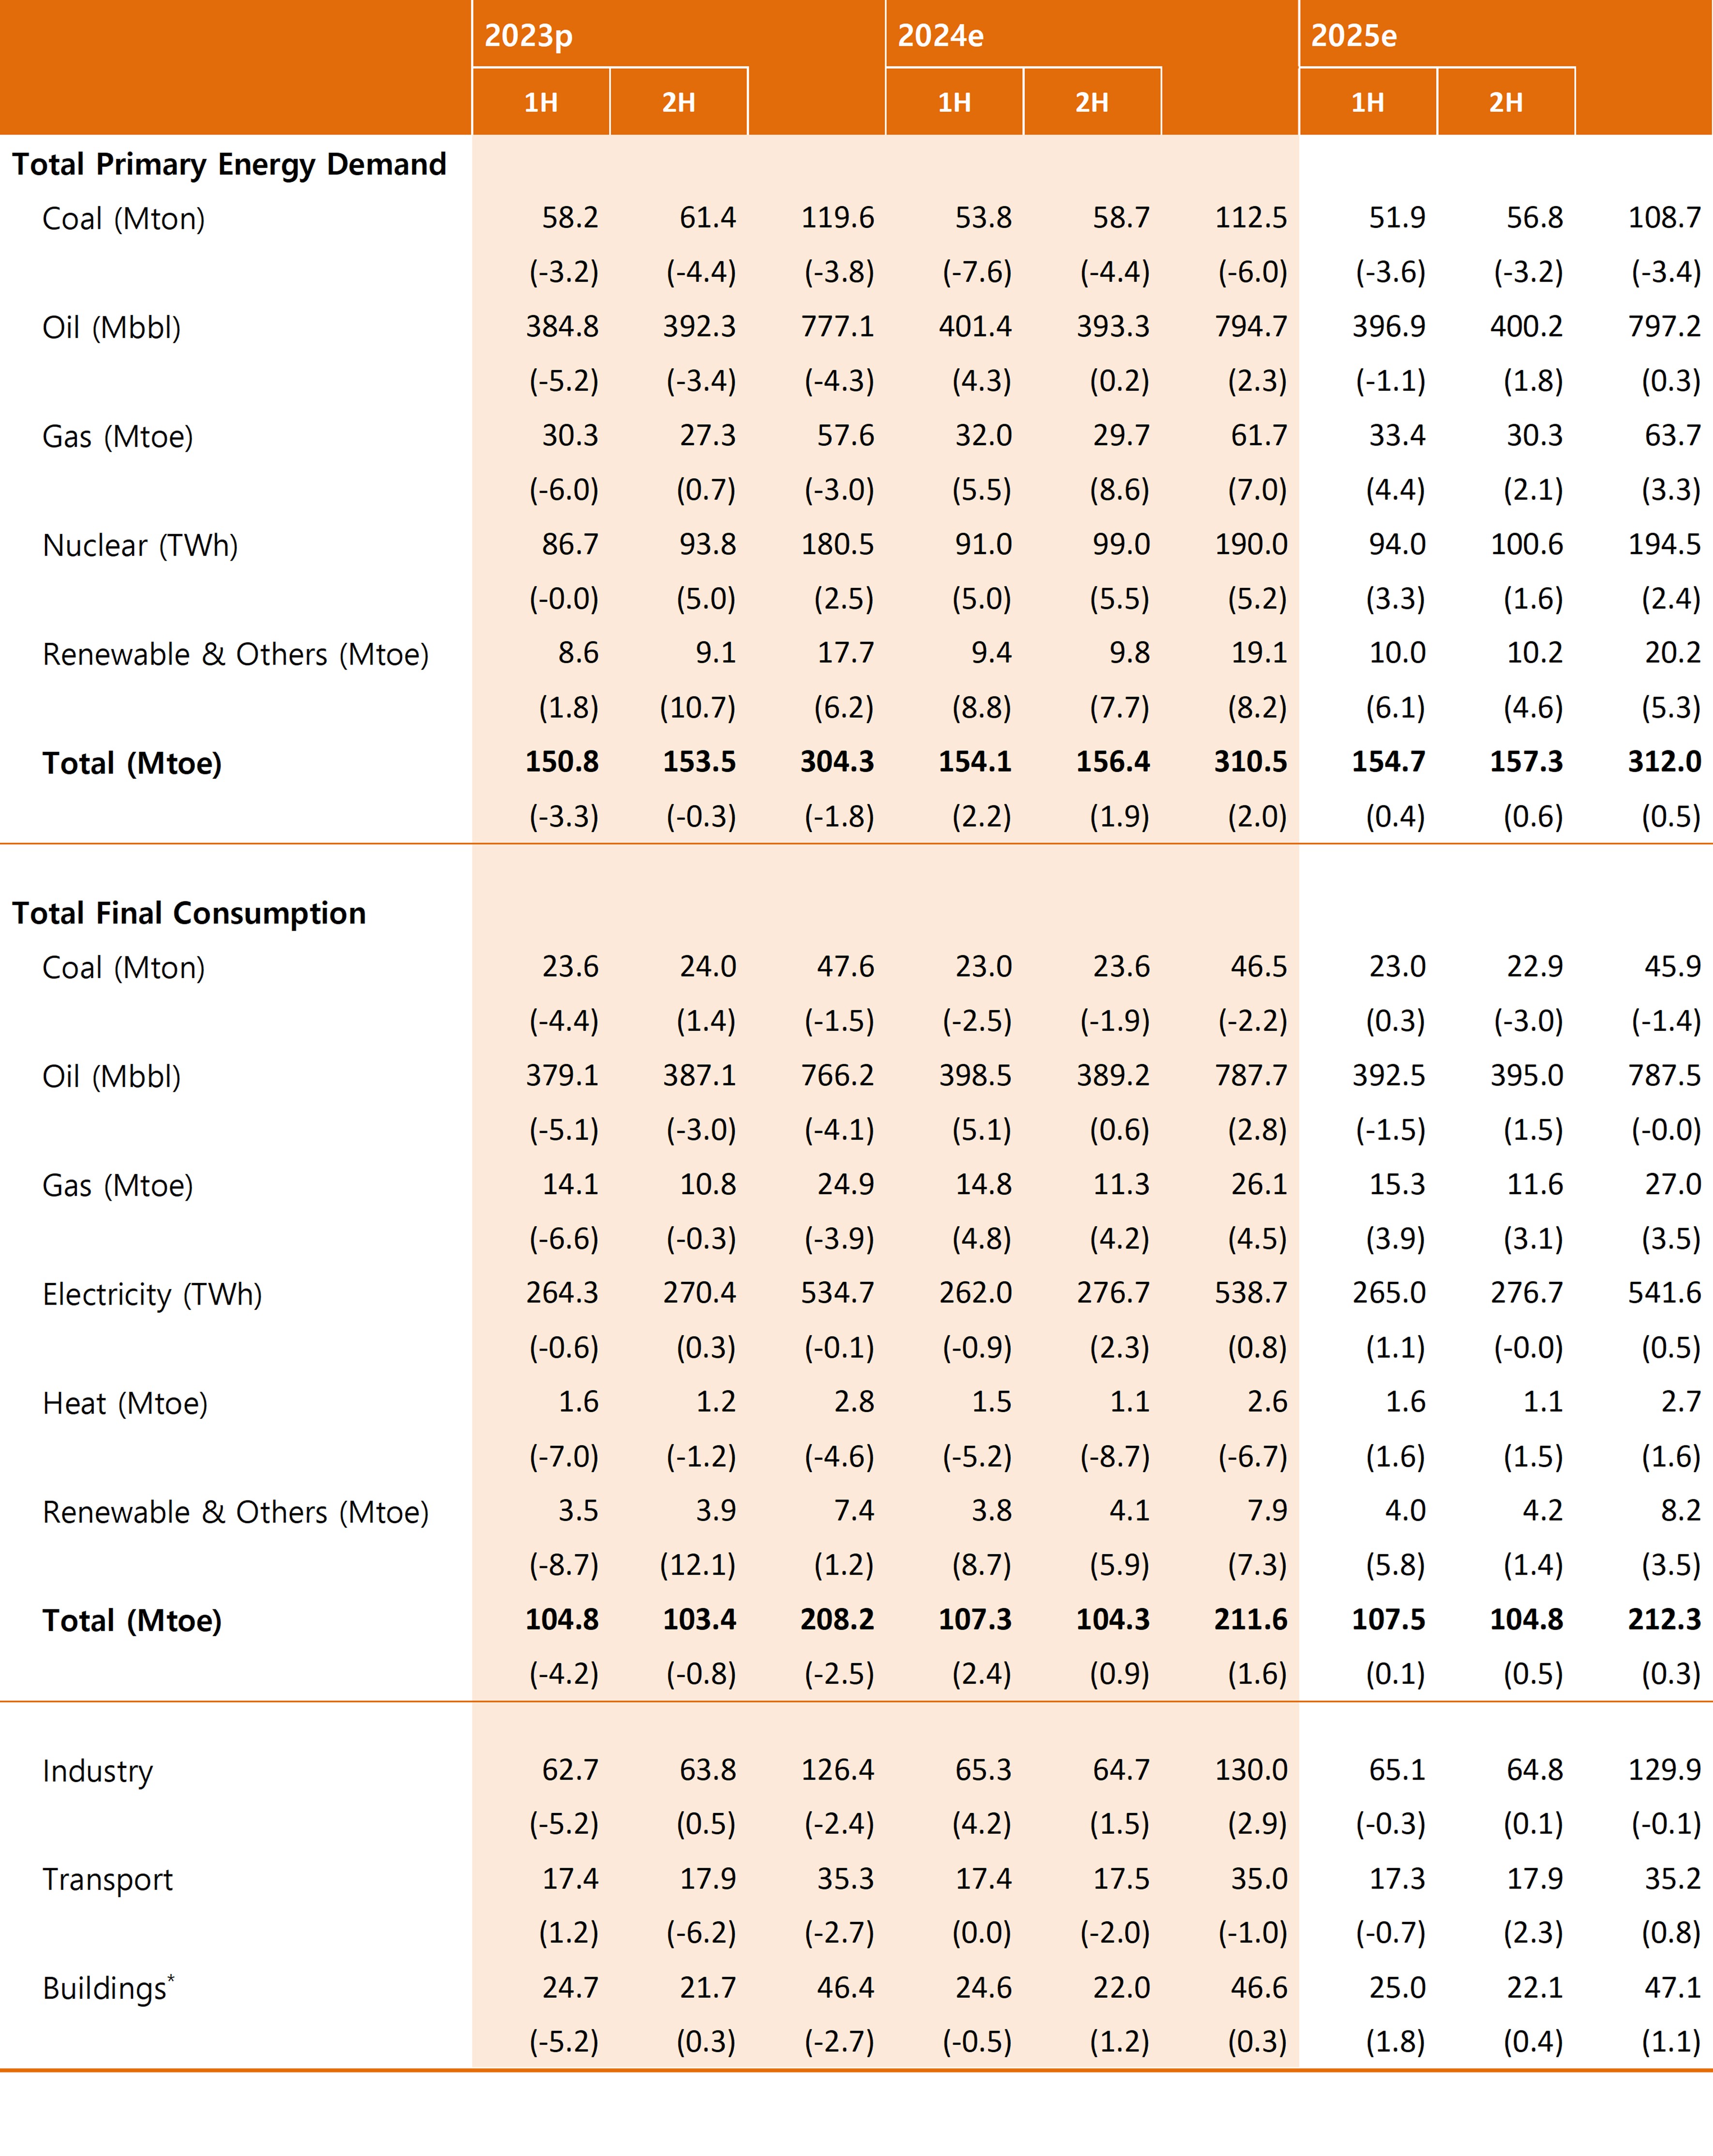
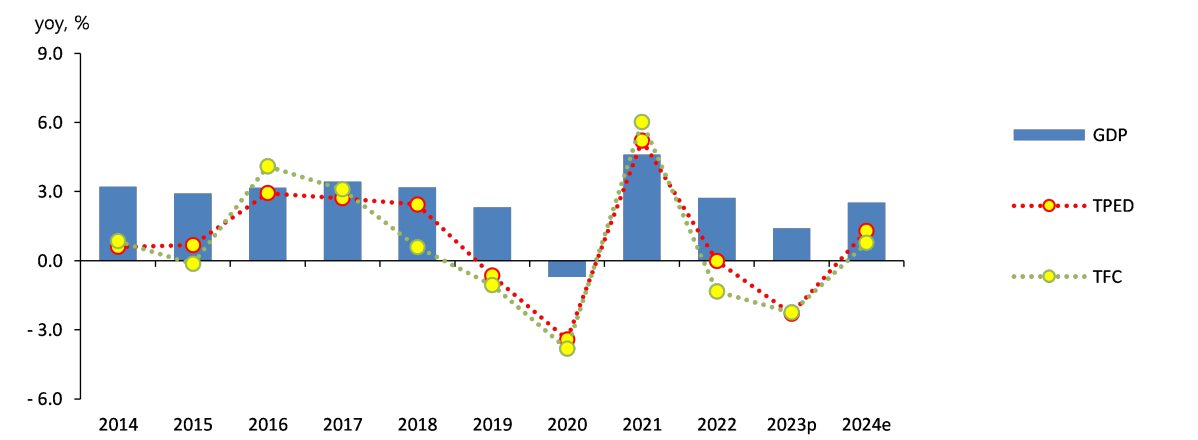
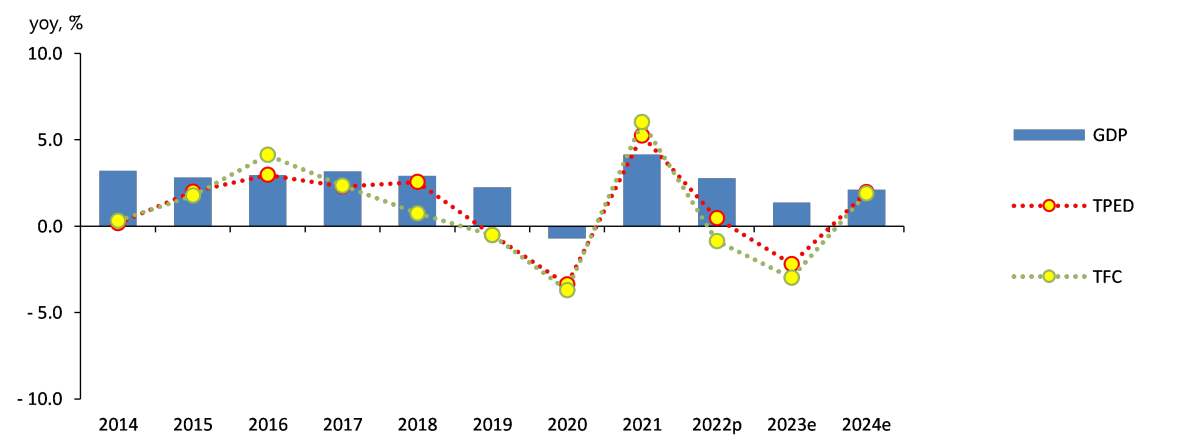
In the first half of 2024, Total Primary Energy Demand (TPED) rebounded by 2.2% year-on-year, but the recovery was weak.
The recovery of energy consumption was limited due to sluggish production in major energy-intensive industries, energy price hikes, and the temperature effect.
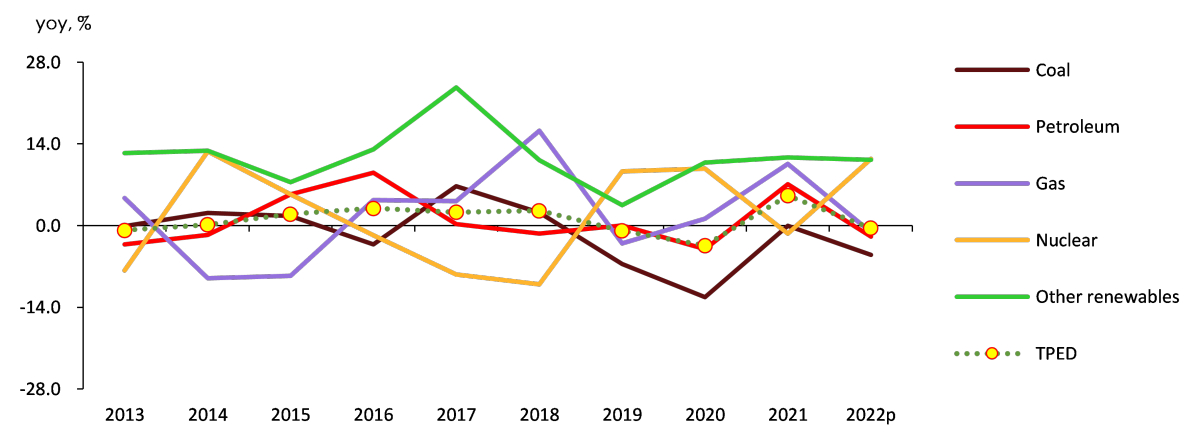
Looking at each energy source, consumption of most energy sources except coal increased year-on-year due to base effects.
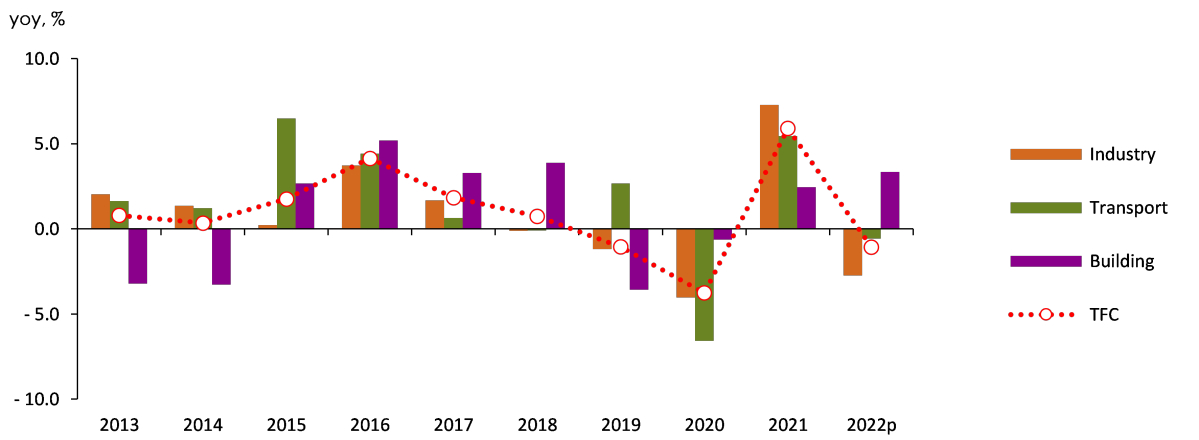
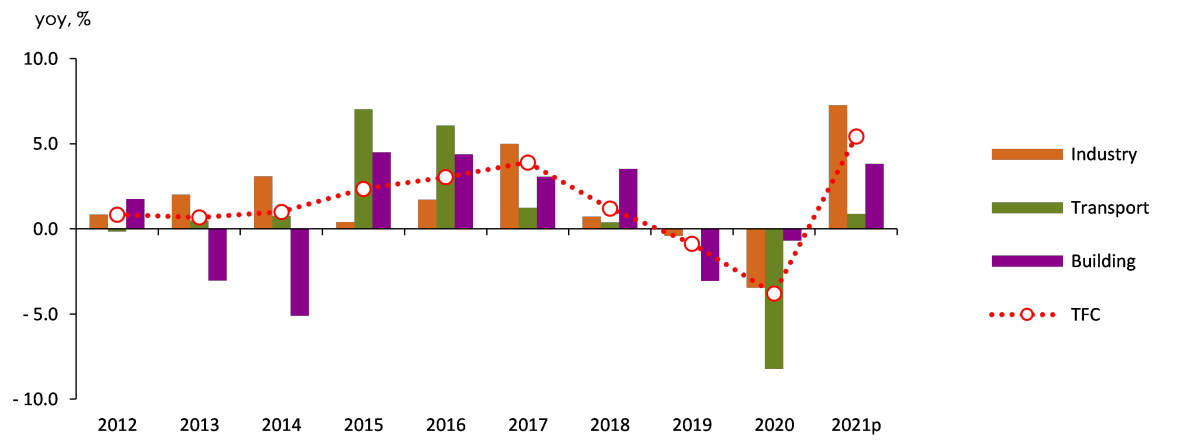
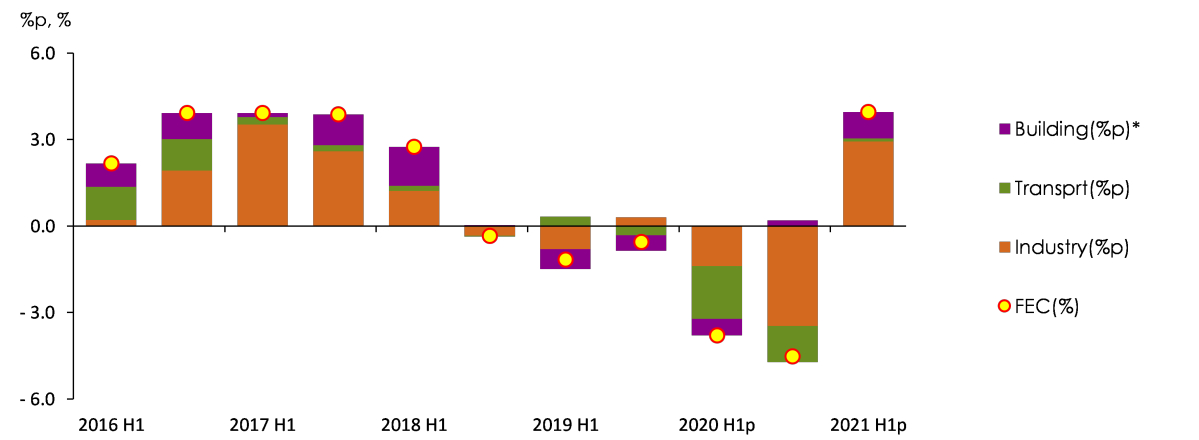
Total final consumption (TFC) increased by 2.4% year-on-year, with a decrease in buildings, a flat trend in transportation, and an increase in the industrial sector.
Consumption in the industrial sector increased by 4.2% year-on-year, with an increase in consumption of petrochemicals and machinery amid a general slowdown in manufacturing activity, and consumption in steel remaining at the previous year's level.
Energy consumption in the transportation sector increased in the road sector, but decreased in all other sectors, including domestic navigation, domestic aviation, and rail, and remained at the same level as the previous year (0.0%).
In the building sector, energy consumption decreased slightly (0.5%) year-on-year due to a decrease in heating degree days and an increase in energy prices for civilian use.
Energy Consumption Trends and Demand Outlook
Energy Demand Outlook
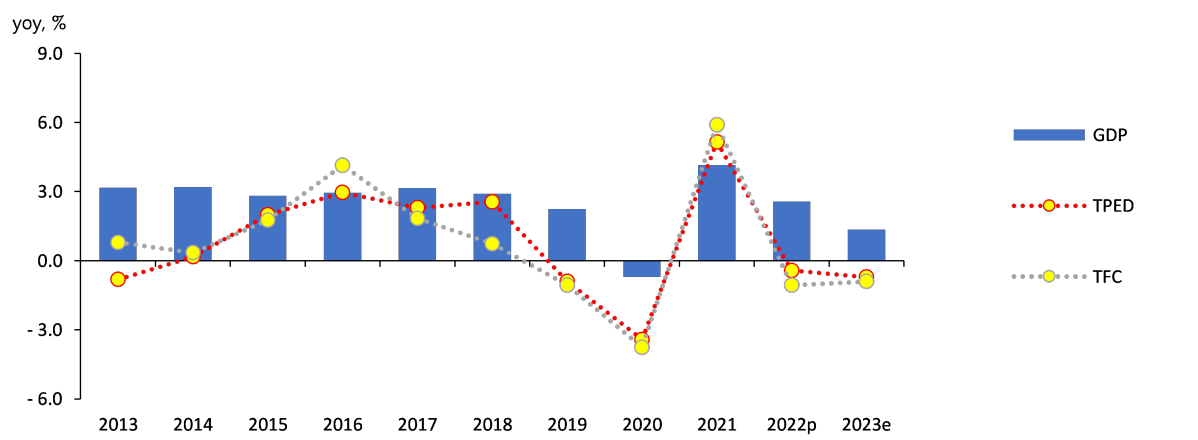
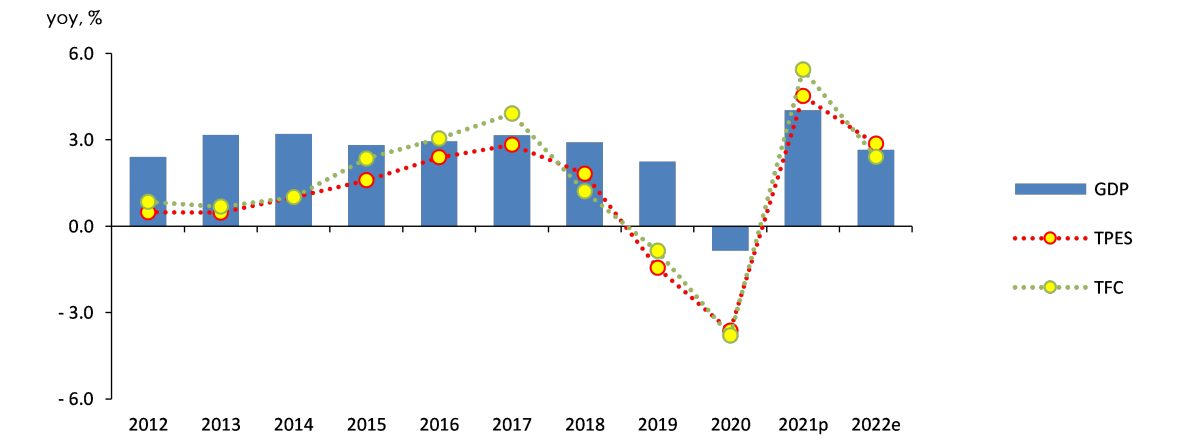
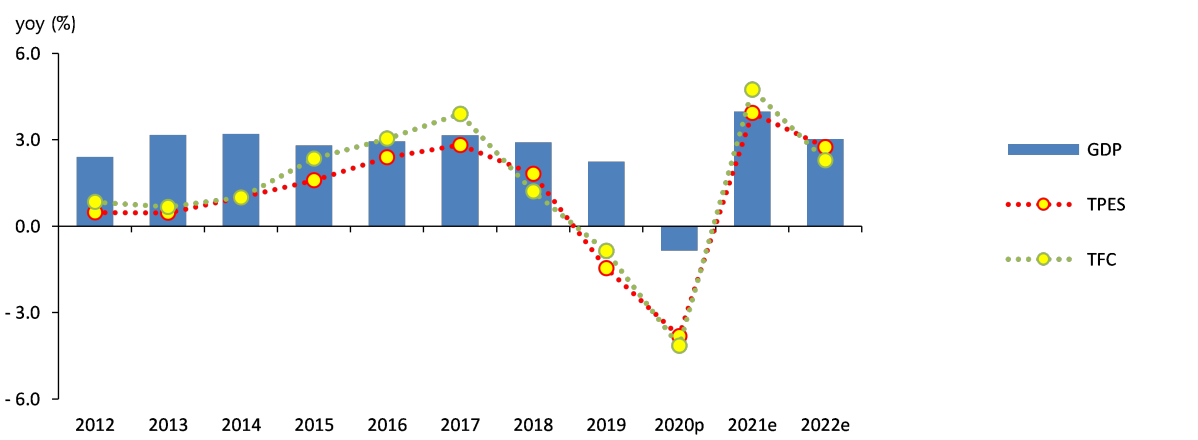
Total Primary Energy Demand is expected to increase by 2.0% in 2024 and 0.5% in 2025, reaching 312.0 million toe.
TPED is expected to increase in 2024, mainly in the industrial sector, but the growth rate is expected to slow down in 2025 due to the delayed economic recovery, mainly in energy-intensive industries.
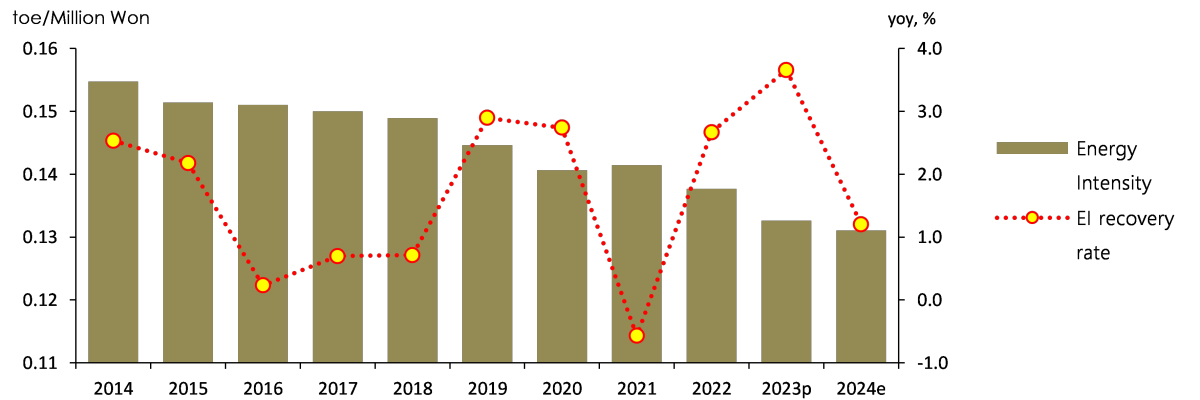
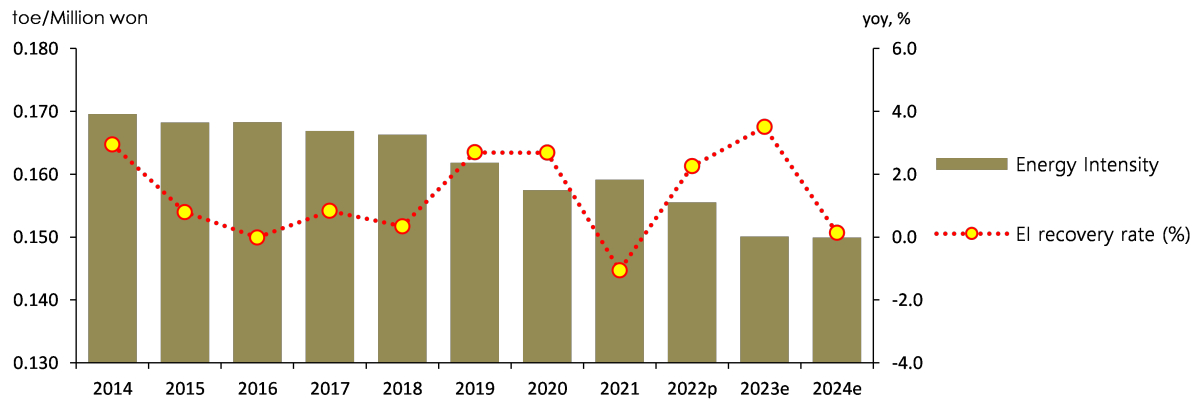
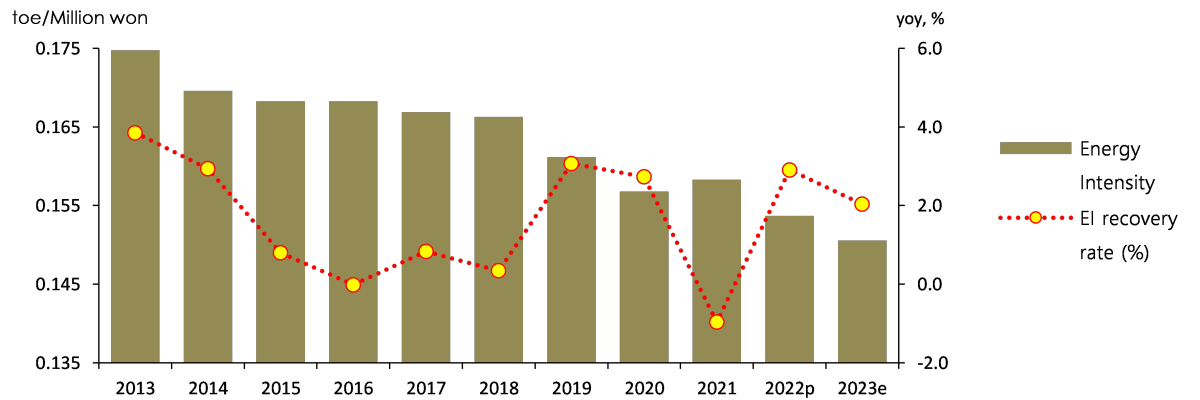
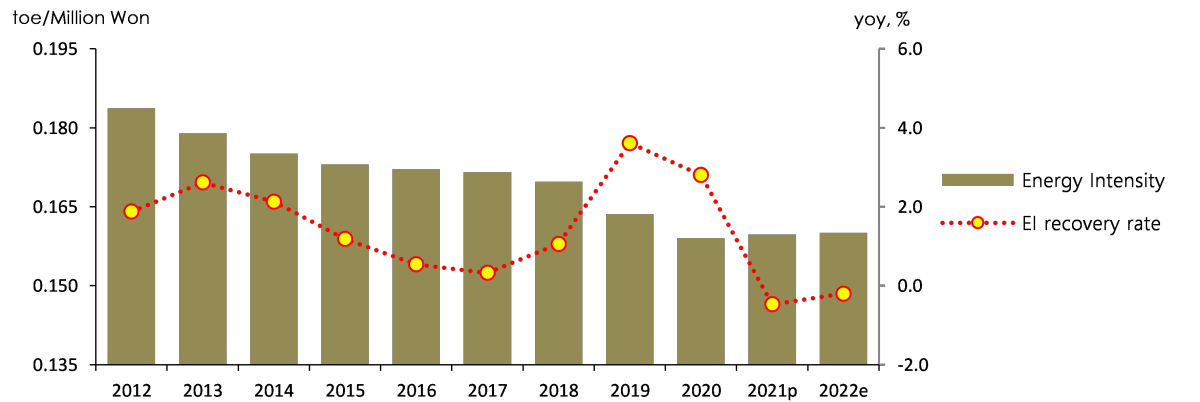
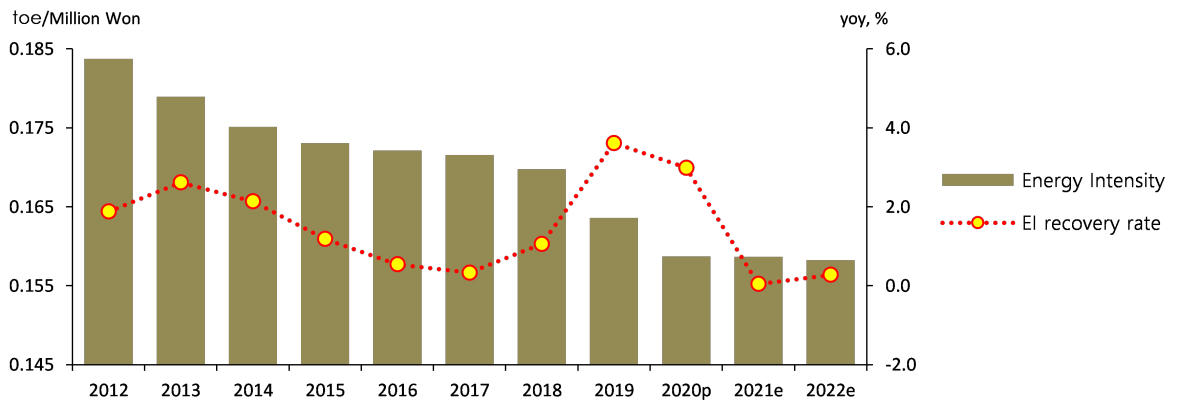
The energy intensity (toe/KRW 100 million) is expected to remain at the previous year's level in 2024 as energy demand rebounds due to base effects, but the improvement in energy intensity is expected to accelerate again in 2025 as energy demand stagnates due to a delay in the recovery of production in energy-intensive industries.
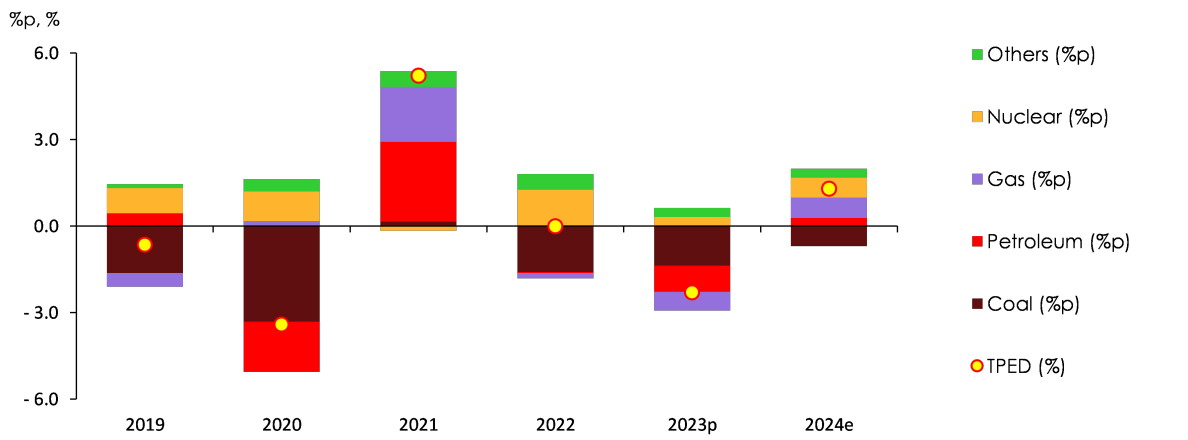
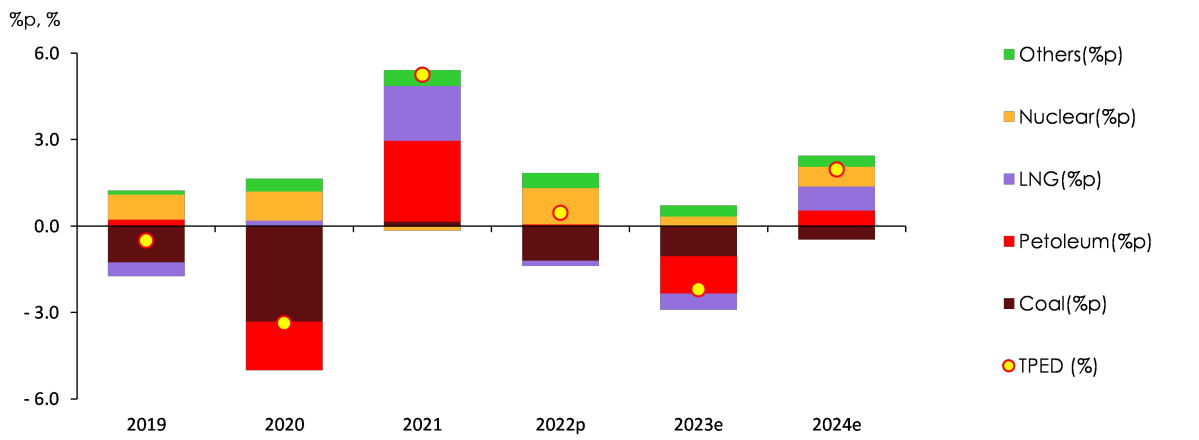
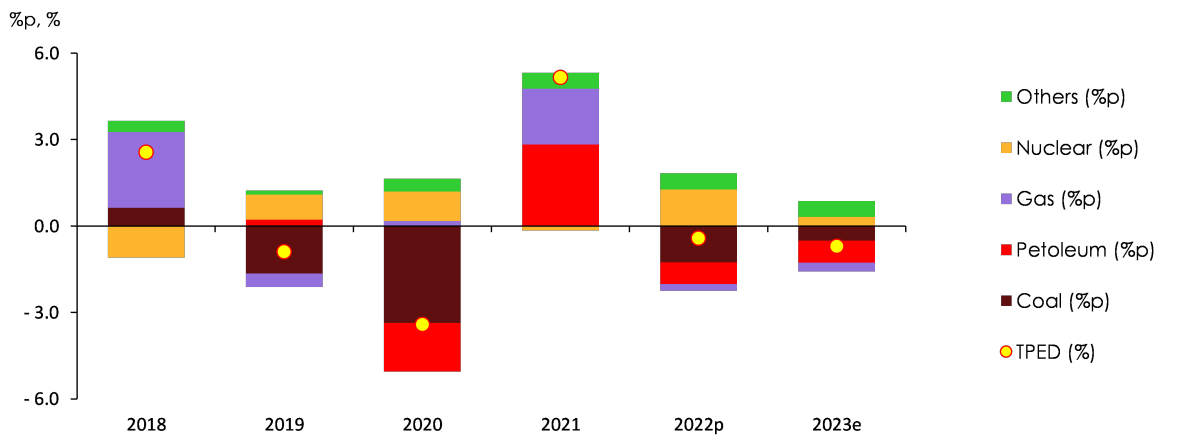
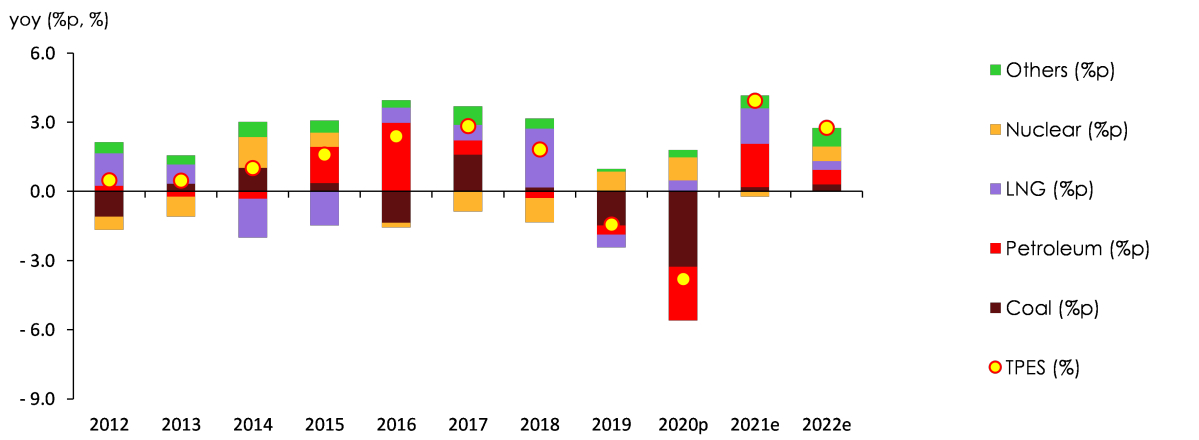
The downward trend in coal demand is expected to ease in 2025, while the growth of other energy sources is expected to slow down.
Oil demand is expected to increase by 2.3% in 2024 due to the base effect, mainly for industrial feedstock, but in 2025, it is expected to increase only slightly (0.3%) due to the delay in the recovery of the petrochemical industry.
Coal demand will decline in both the power generation and industrial sectors during the forecast period, falling by 6.0% in 2024 and easing in 2025, but continuing to decline by 3.4%.
Nuclear power generation is expected to increase by 5.3% and 2.4% in 2024 and 2025, respectively, due to the impact of new nuclear power plants entering the market.
Natural gas demand is expected to increase by 6.2% in 2024 and 4.4% in 2025, as the growth in demand for gas manufacturing is expected to expand, but the growth in demand for power generation is expected to slow down.
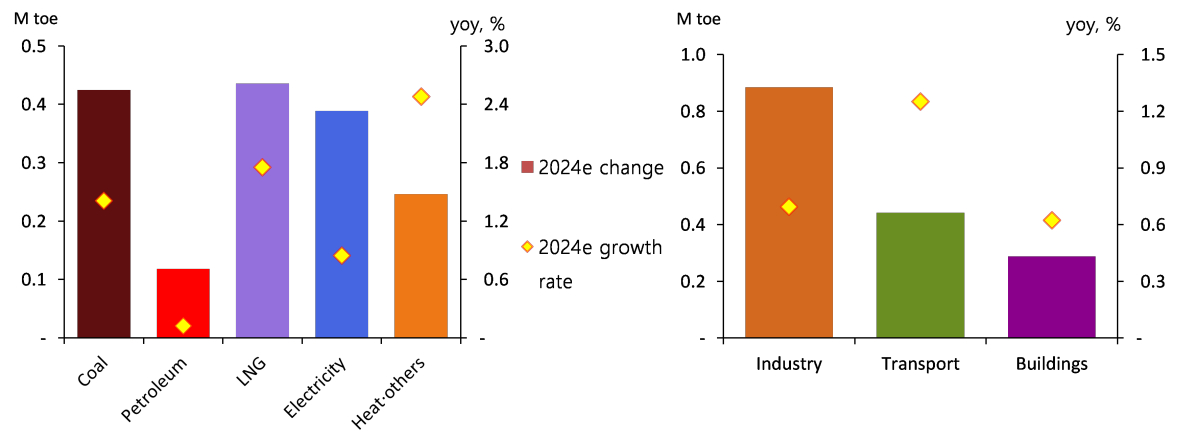
Electricity demand in the final consumption sector is expected to slow down from 0.8% growth in 2024 to 0.5% growth in 2025 due to the delayed recovery of electricity-intensive industries.
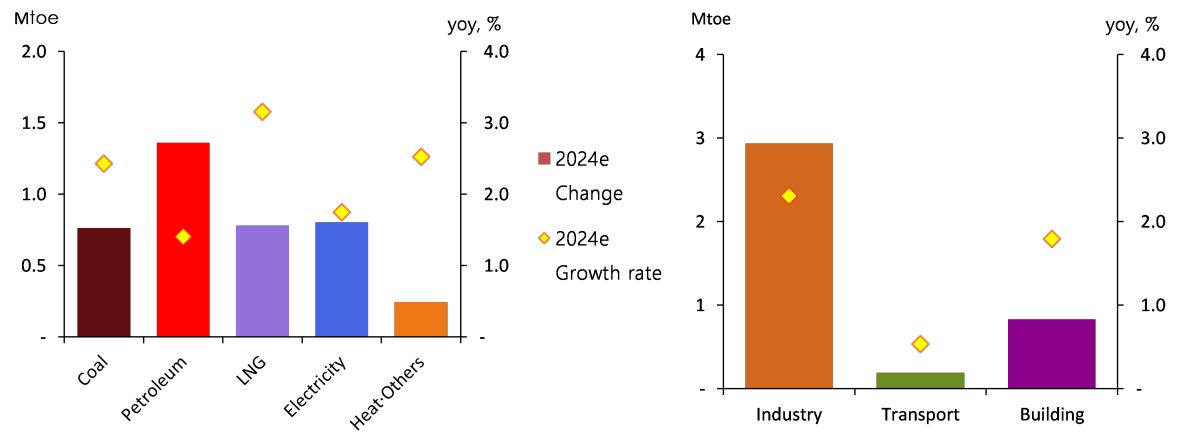
The growth rate of total final consumption is expected to slow down from 1.6% in 2024 to 0.3% in 2025.
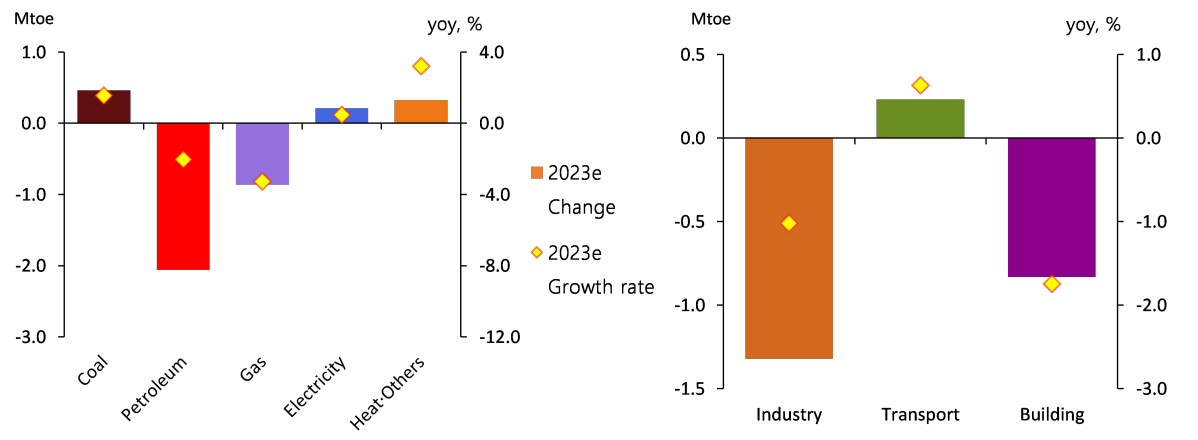
The energy demand in the industrial sector is expected to increase by 2.9% in 2024 due to the base effect despite the recession in the manufacturing industry, but in 2025, it is expected to slightly fall short of the previous year's level (-0.1%) due to the continued sluggishness in the steel and petrochemical industries.
In the transportation sector, energy demand is expected to decrease by 1.0% in 2024 due to sluggish demand for freight transport due to the economic slowdown, but is expected to turn to a slight increase (0.8%) in 2025 as the economy recovers somewhat in the second half of the year.
Energy demand in the building sector is expected to increase by 0.3% year-on-year in 2024, mainly for cooling, and by 1.1% in 2025, mainly for heating.
Key Features and Implications
Decoupling of economic growth and energy consumption in the industrial sector
While the added value of the manufacturing industry has increased, energy consumption has decreased, resulting in a decoupling of economic growth and energy consumption.
In the last five years (2018-2023), the Korean economy has grown at an annual average rate of 2.1%. Despite the relatively sluggish manufacturing industry compared to the past, the manufacturing industry, along with the service industry, plays a major role in economic growth.
Value added, energy consumption growth rate, and energy intensity improvement rate for the period 2018-2023
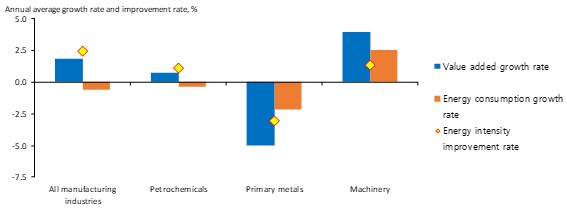
Contrary to the increase in added value, energy consumption in the manufacturing industry as a whole has decreased over the past five years, which is the main reason for the slowdown in the growth of energy consumption in the country as a whole compared to economic growth.
The outlook for the domestic manufacturing industry over the next five years is expected to follow the trend of the past five years, with growth centered on machinery, especially semiconductors, rather than petrochemicals or primary metals. This means that the manufacturing industry's energy intensity will continue to improve and the decoupling of economic growth and industrial energy consumption will continue.
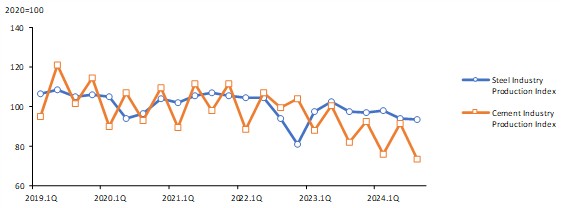
Coal demand in the steel and cement industries will continue to be sluggish.
Due to the downturn in the business environment, coal consumption in the steel and cement industries, which are coal-intensive industries, has shrunk significantly.
Coal consumption in the steel industry peaked in the second quarter of 2018 and has been on a downward trend until the third quarter of 2024 due to sluggish production activity.
The coal consumption of the cement industry, which is highly dependent on domestic demand, has been declining rapidly since 2019 due to the sluggish domestic construction market and a decline in production activities.
Production Index Trends by Industry
Coal Consumption Trends by Industry
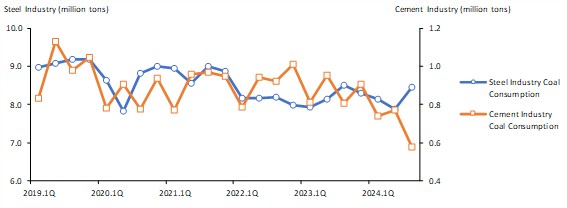
Steel industry coal consumption will remain at the same level as in 2025, but cement industry consumption is expected to continue to decline in 2025.
In 2025, steel production will shrink due to a decrease in production in the major demand industries, such as automobiles and shipbuilding, compared to 2024, but it is expected to remain at the same level as in 2024 due to increased exports to emerging countries (India, ASEAN, etc.) and Europe. (Korea Institute for Industrial Economics & Trade 2024.11.25.)
Construction investment in 2025 is expected to continue the sluggish trend of 2024 due to the cumulative sluggishness of construction-related leading indicators (construction start-up area) and the government's reduction in the SOC budget (-3.6% year-on-year) despite positive factors such as interest rate cuts and a recovery in the real estate market. (Korea Institute for Industrial Economics & Trade 2024.11.25.)
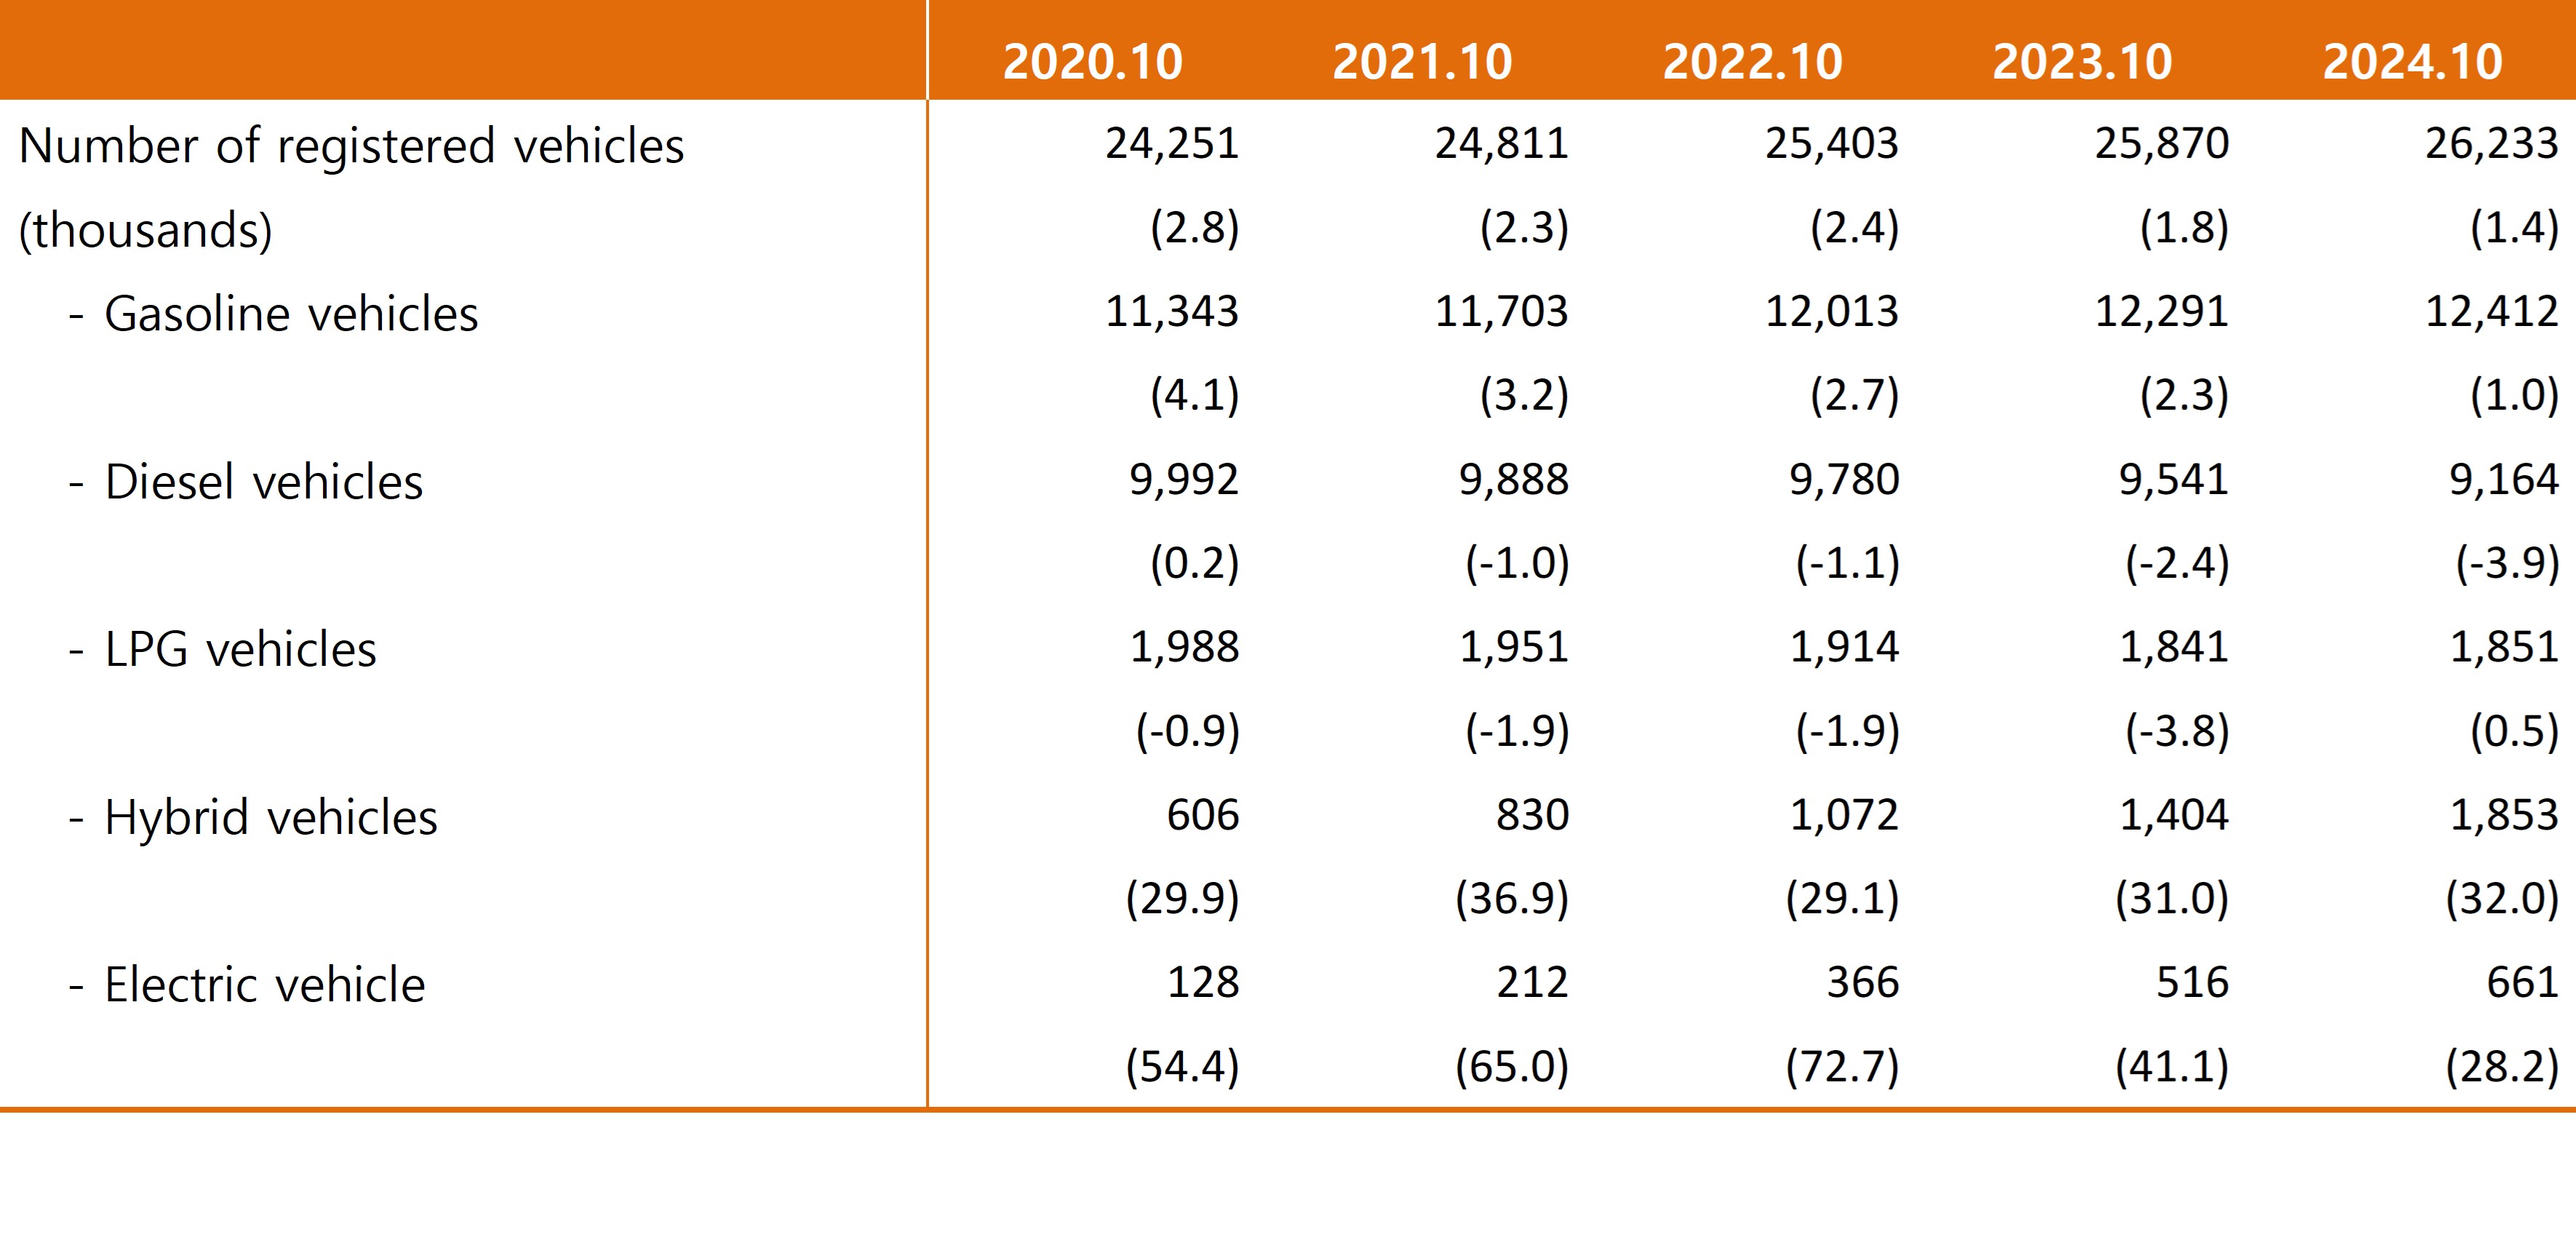
Changes in transportation policy and the number of registered cars
The government's policy on LPG vehicles has changed, and the decline in the number of LPG vehicles will be significantly eased by 2024.
The number of LPG vehicles registered and the consumption of LPG in the transportation sector have been declining continuously, but in 2024, the discontinuation of existing diesel trucks and the launch of new LPG 1-ton trucks will significantly ease the decline in the number of LPG vehicles registered.
There is a movement to increase the number of LPG vehicle registrations and increase LPG demand as a substitute for diesel vehicles, but in the long term, the number of LPG vehicles is expected to decrease as the government strengthens its support system for the purchase of eco-friendly vehicles.
The rate of increase in the number of registered electric vehicles, which has been growing rapidly recently, is slowing down, and the number of diesel vehicles is continuing to decrease.
The number of new sales and registrations of electric vehicles is still increasing, but the rate of increase is slowing down.
The number of diesel-powered vehicles registered has continued to decline as diesel vehicle reduction policies have been implemented.
Number of vehicles registered by fuel type in Korea (as of October)
 Attachments
-
 N_2024H2.png
Download
N_2024H2.png
Download
-
 EnergyOutlook_2024H2.pdf
Download
View Details
EnergyOutlook_2024H2.pdf
Download
View Details
-
2024 Energy Demand Outlook (2024, First Half)
- Date2024/07/19
- Author Department of Energy Outlook Research
- Number of downloads 71
-
Download multiple files Download the entire file
Energy Consumption Trend
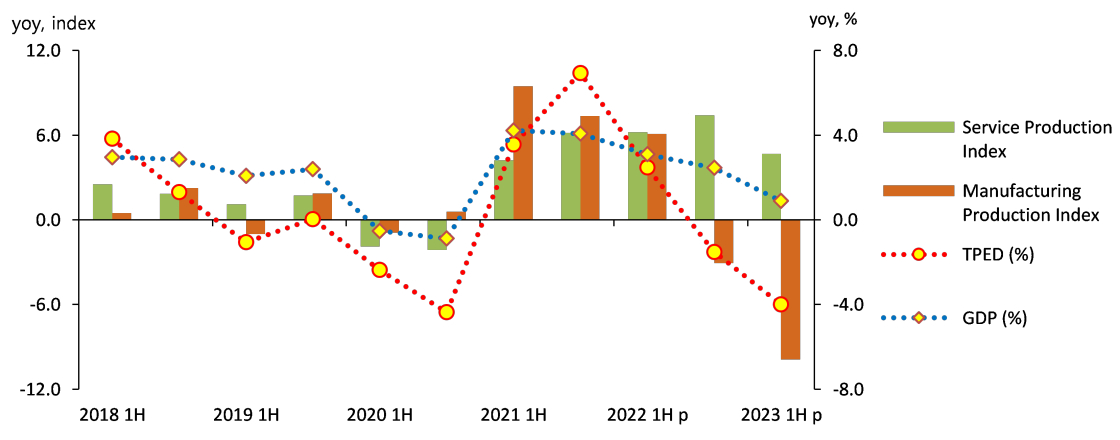
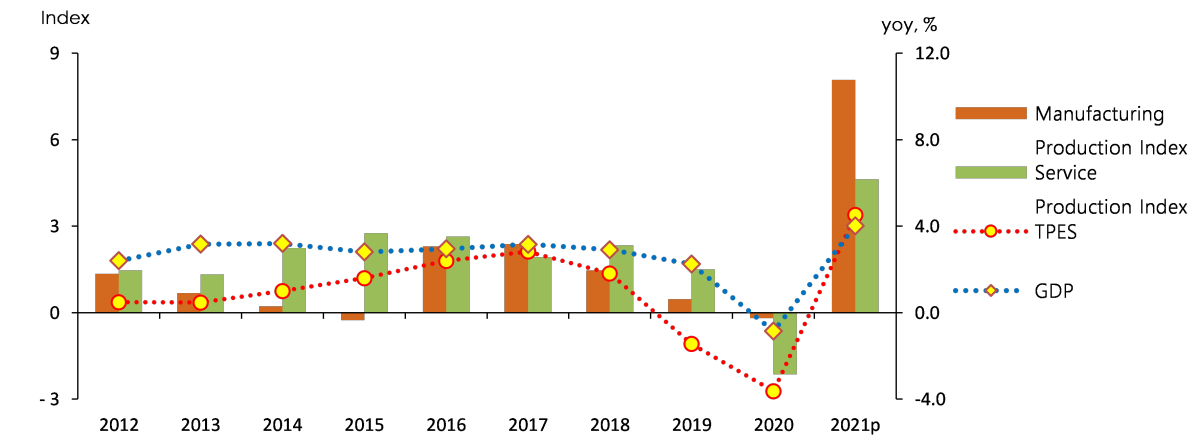
Total primary energy demand (TPED) in 2023 decreased by 2.3% y-o-y to 297.5 million toe due to a decline in manufacturing production activity.
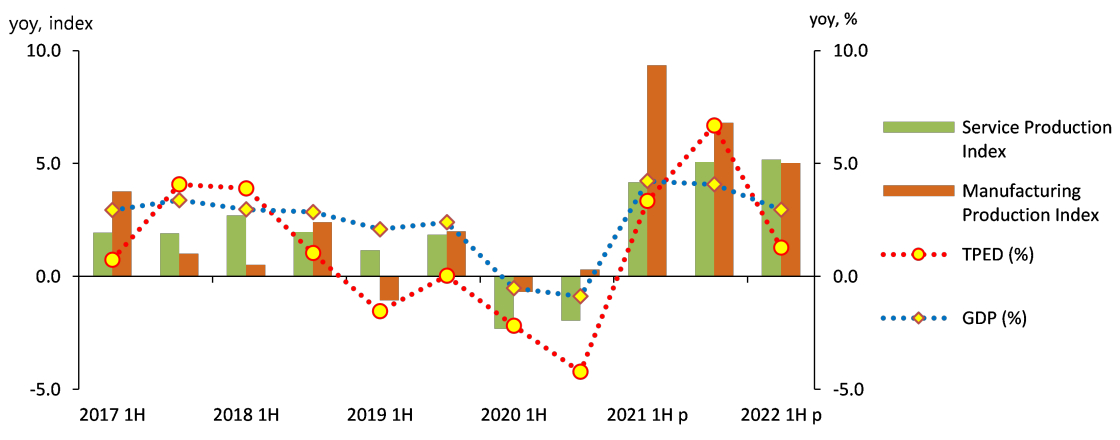
Despite the decline in manufacturing production, the economy grew by 1.4% y/y due to an increase in service sector production and lower international energy prices, but energy consumption declined mainly in the energy-intensive industrial sector.
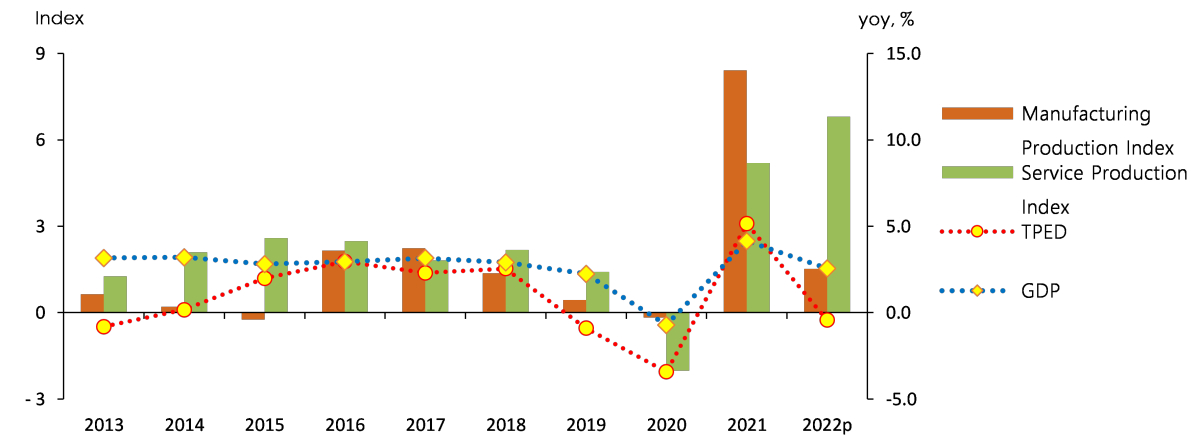
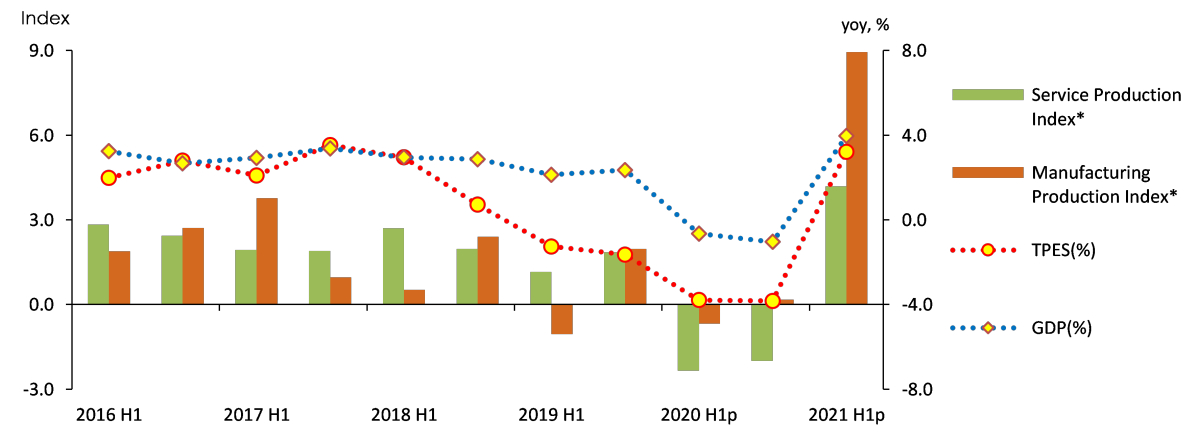
The growth rates of GDP and TPED, production index
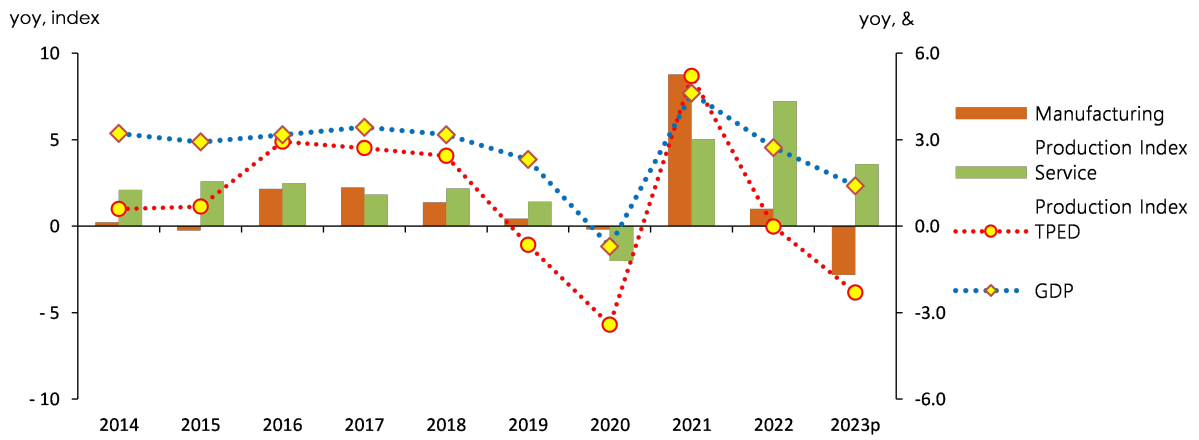
Note: Production indexes show year-on-year differences.
Energy intensity (TOE/million KRW) improved (decreased) by 3.7% year-on-year as economic growth fell by 1.3 percentage points year-on-year, but total energy consumption fell more (2.3 percentage points).
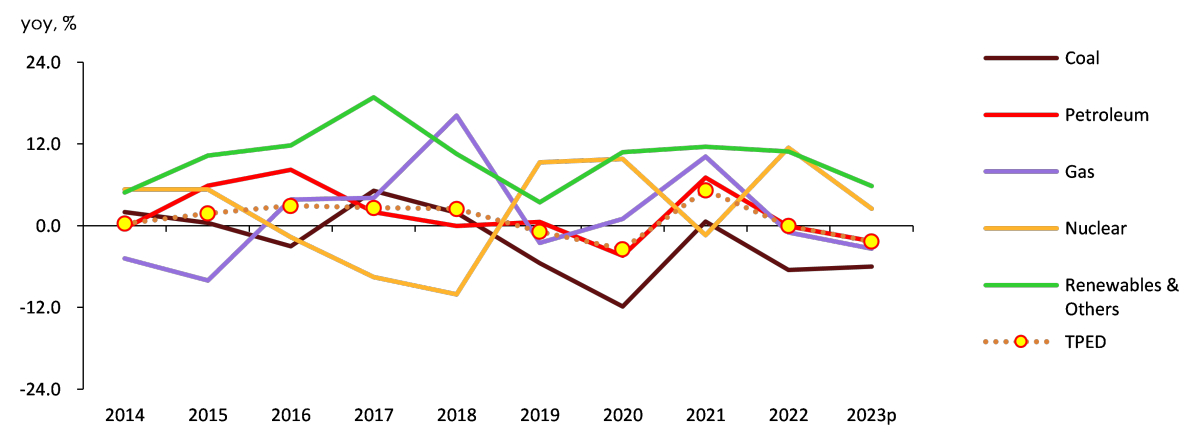
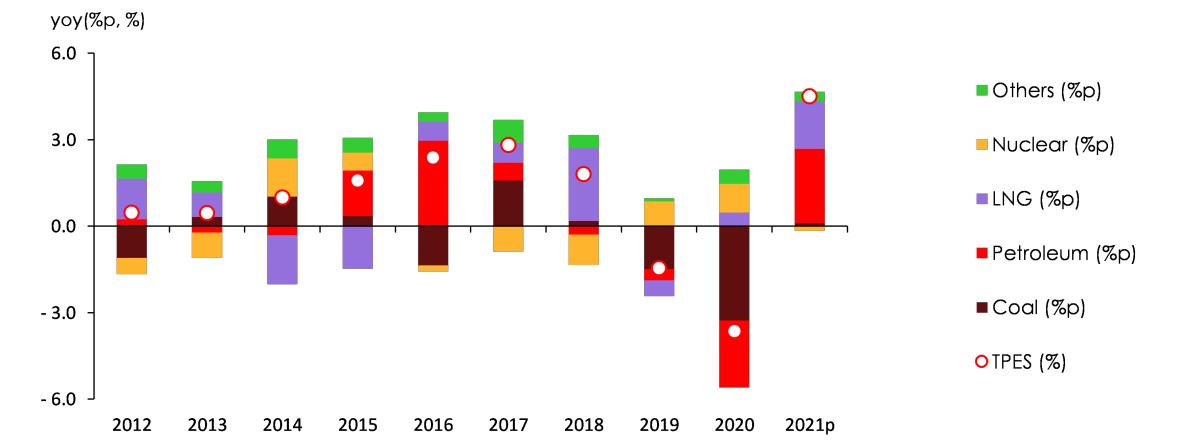
In TPED, nuclear and renewable consumption increased, while coal, oil and gas consumption decreased year-on-year.
Coal consumption decreased by 6.3% y/y, as the decline widened in the power generation sector due to grid constraints and increased nuclear and renewable generation, and continued to decline in the industrial sector due to stagnant consumption in the steel industry and contraction in petrochemicals and cement due to the slowdown in the economy.
Oil consumption decreased by 4.3% y-o-y, with the decline in industrial use widening to raw materials due to the slowdown in petrochemicals, and in transportation due to the decline in the quantity of goods transported as a result of the reduction in production activities, despite the increase in passenger travel demand.
Gas (natural + city) consumption decreased by 3.3% YoY, with a faster decline in power generation due to lower electricity consumption, and a decline in both industrial and building use due to the slowdown in the economy, temperature and price effects.
Nuclear power increased by 2.5% YoY due to reduced preventive maintenance and the entry of Shin-Hanul Unit 1 (2022.12), while renewables increased by 5.8% YoY, led by solar, bio and fuel cell power generation.
TPED share was oil (39.8%), coal (22.0%), gas (19.3%), nuclear (12.9%), and renewable/other (6.0%), while the share of non-fossil energy continued to rise, reaching 18.9%.
The growth rates of energy use by major energy source
Meanwhile, electricity consumption, a secondary energy, shifted to decline in industrial use due to the slowdown in the economy, while building use declined 0.1% year-on-year due to slower growth in service sector production, fewer heating and cooling degree days, and higher electricity prices.
Final energy consumption in 2023 is down 2.3% y/y, with declines in the industrial, transportation and buildings sectors.
Industrial sector energy consumption continues to decline, falling 1.7% y/y, with a slight increase in consumption in steel and machinery, but a significant decline in petrochemicals, amid a slowing economy.
Transportation sector energy consumption decreased by 2.8% year-on-year, with declines in road, domestic aviation, domestic navigation, and rail, reflecting lower freight volumes due to the slowdown, despite lower petroleum product prices and higher travel demand.
The growth rates of TFC by end-use sector
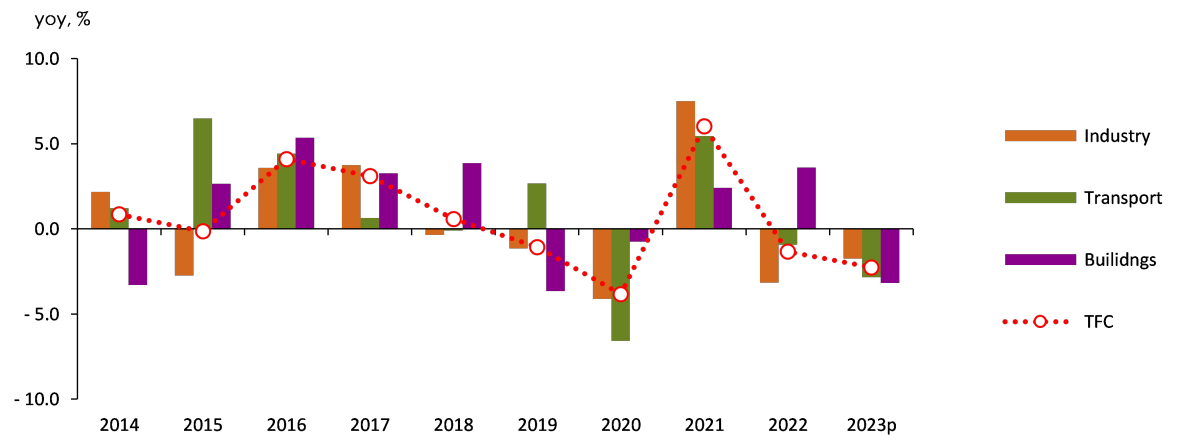
Note: The Building sector includes residential, commercial and public-etc usage.
Energy consumption in the buildings sector decreased 3.2% year-over-year, with a decline in the residential sector and only a slight increase in the commercial sector due to higher energy prices, temperature effects, and slower service production.
Energy Demand Outlook
TPED is forecast to reach 301.4 million toe in 2024, an increase of 1.3% year-on-year.
TPED, which has been declining since 2021 due to the slowdown in economic growth, is expected to turn to growth in 2024 as economic growth picks up somewhat.
As the economy is expected to grow by 2.5% in 2024, up from 1.4% in 2023 (BOK 2024.5), energy demand is expected to rebound from the previous year's decline, but the growth will not be fast due to the slow recovery of major energy-intensive industries.
The growth rates of GDP, TPED and TFC, trend and outlook
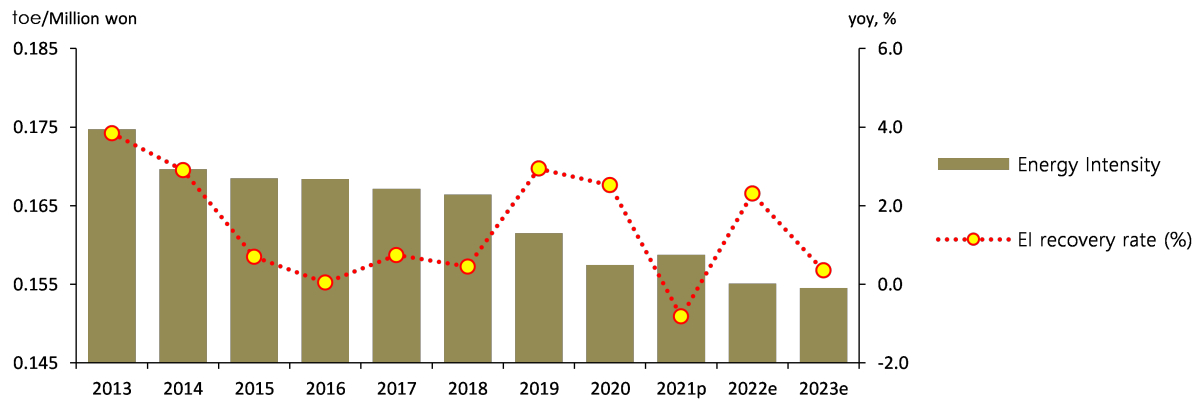
Energy intensity (TOE/million) is expected to continue to improve in 2024, decreasing 1.2% year-over-year.
Energy Intensity and EI Recovery Trends
Note: Energy Intensity is calculated as the value of 'TPED/GDP', expressed in toe/million won, EI recovery rate multiplies EI increase rate by '-1'.
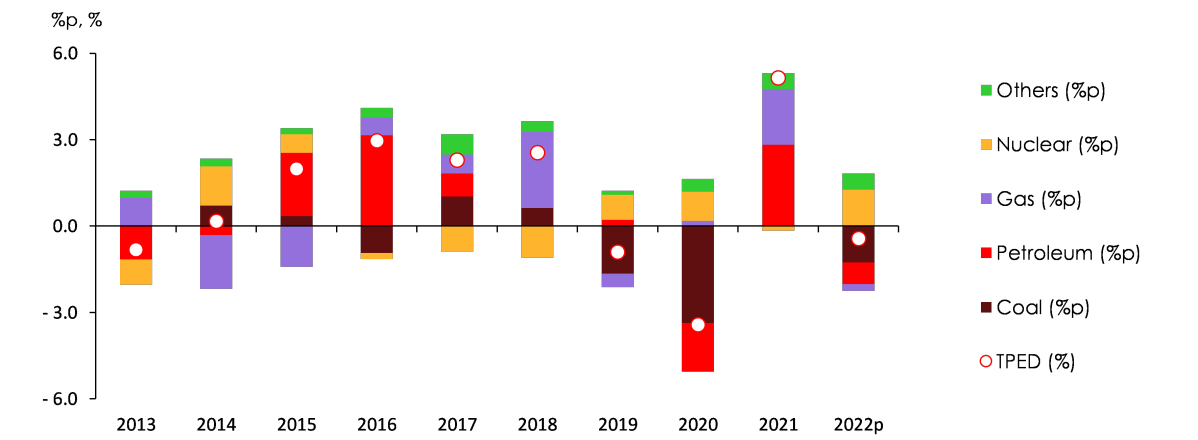
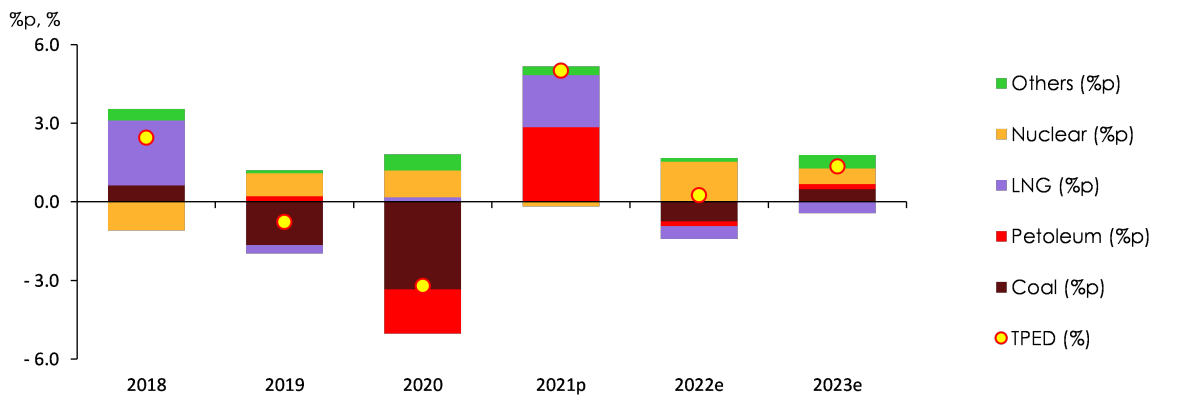
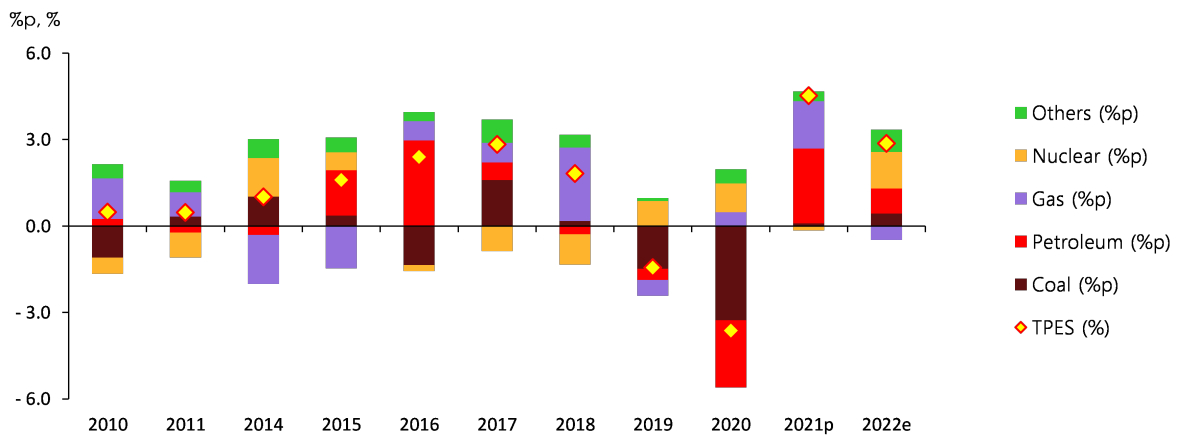
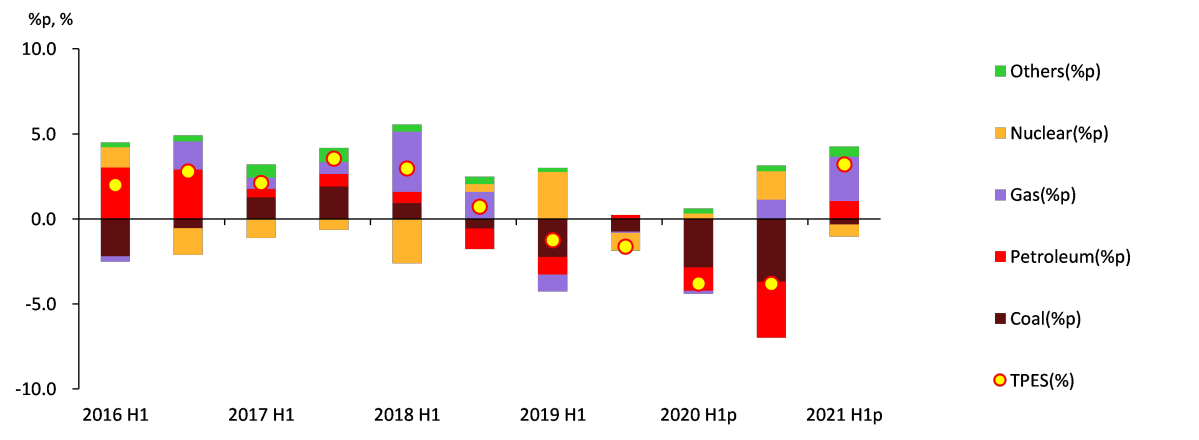
Coal continues to decline, oil and gas rebound from two consecutive years of decline, nuclear and renewables continue to grow.
Coal demand is forecast to decline by 3.4% y/y, with industrial rebounding, but power generation continuing to decline.
Oil demand is forecast to increase 0.7% y/y, led by feedstock use, with a slight improvement in petrochemicals.
Gas (natural + city) demand is expected to increase by 3.7% YoY, with both power generation and final consumption rebounding.
Nuclear power generation is expected to increase by 5.3% year-on-year due to the entry of Shin-Hanul Unit 2 and Saeul Unit 3. Renewable energy is also expected to increase by 9.3% due to continued expansion of power generation facilities.
The growth rate of TPED & contributions by source
Note: TPED growth rate(%) is the sum of contributions (%p) by energy source.
Electricity demand is forecast to increase 0.8% year-over-year, with growth in industrial, residential, and commercial use.
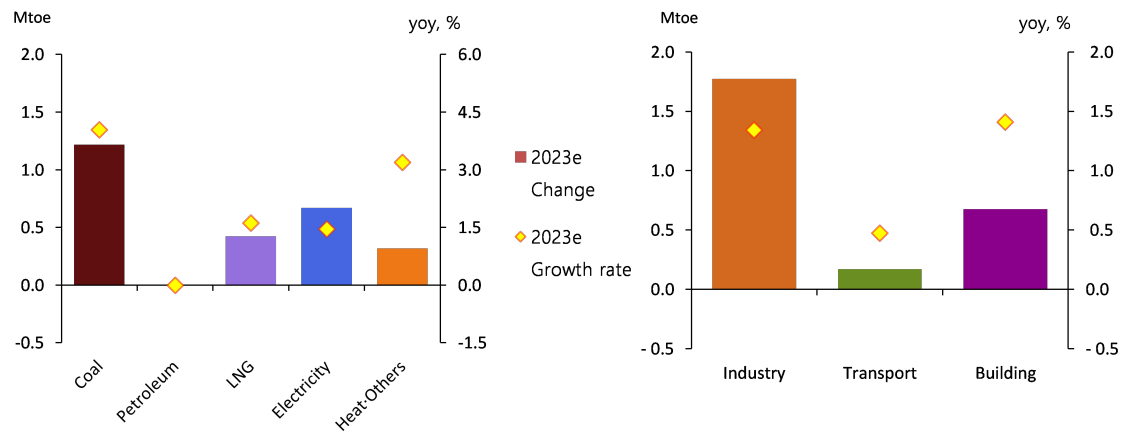
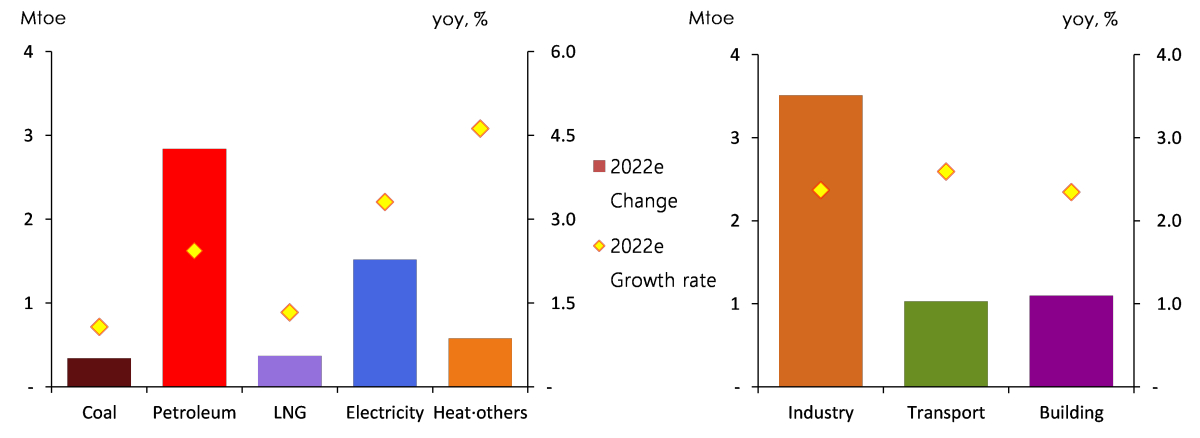
Final energy consumption is expected to increase by 0.8% y/y, with all sectors reversing the previous year's decline to increase.
In the industrial sector, energy demand is forecast to increase by 0.7% y/y, driven by a slow recovery in petrochemicals and steel, but rebounding in feedstock due to the base effect of the previous year's decline.
The change and growth rate of TFC by energy source and end-use sector
Transportation sector energy demand is forecast to increase 1.3% year-over-year, with gasoline growth sustained by higher passenger travel demand, and diesel demand rebounding as freight volumes recover partially.
Energy demand in the buildings sector is forecast to increase slightly (0.6%) year-over-year, despite a decline in heating and cooling degree-days, due to a base effect from the previous year's rapid decline (-3.2%).
Key Features and Implications
The impact of China's petrochemical industry self-sufficiency improvement
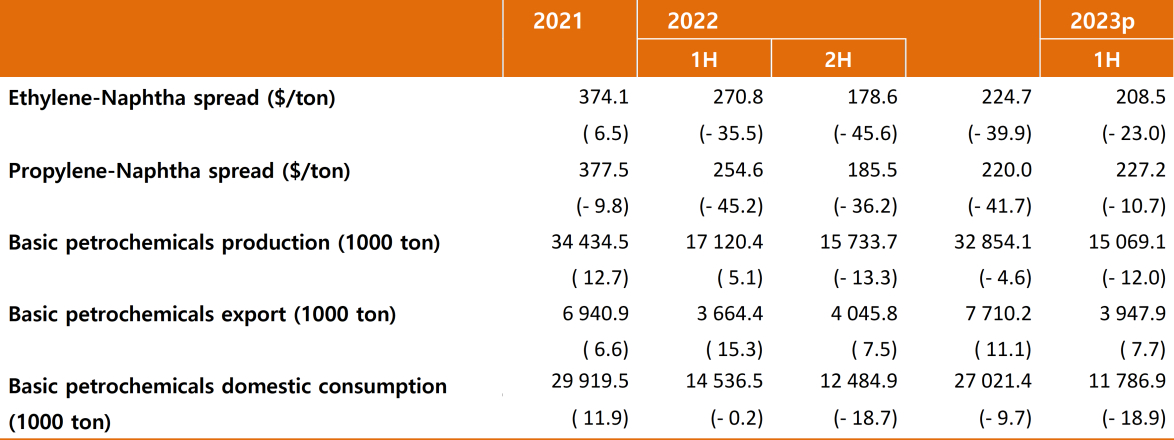
The petrochemical industry is showing signs of improvement, led by exports, amid weak domestic demand, but the outlook is negative.
In 2023, basic petrochemicals production decreased by 5.2% y-o-y, due to the downturn in the petrochemical industry that started in the second half of 2022, but increased by 5.5% y-o-y in the first quarter of 2024. Intermediate product output is still on a declining trend.
Monthly exports of basic petrochemicals & intermediates
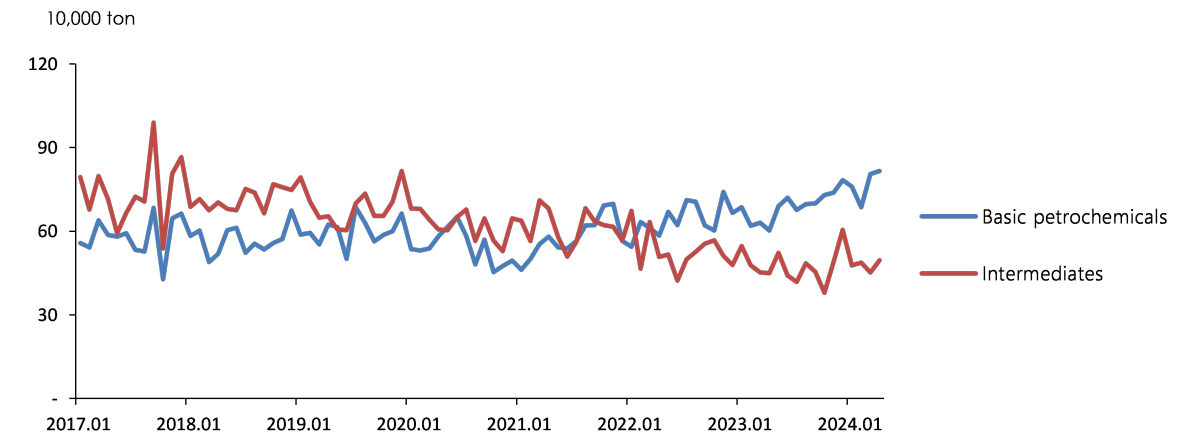
Source: Korea Petrochemical Industry Association
Korea's petrochemical exports are likely to continue to decline due to China's policy of increasing self-sufficiency in the petrochemical industry.
The Chinese government has significantly increased petrochemical capacity investment since 2019 to increase the self-sufficiency rate of the petrochemical industry, and the self-sufficiency rate of most basic petrochemicals and intermediates is expected to exceed 100% by 2025.
Exports to China, South Korea's largest importer of petrochemicals, are expected to continue to decline, resulting in only modest growth or stagnation in demand for naphtha and LPG, which are feedstocks for the petrochemical industry.
Residential electricity demand and electricity bill burden in summer 2024 due to heat wave
Estimated that even a spike in electricity use for cooling in the worst heat wave would only increase electricity bills by about KRW 30,000.
To analyze changes in residential electricity consumption for summer temperature scenarios, we split residential electricity consumption into cooling and non-cooling consumption, using consumption in months when little cooling or heating occurs.
Summer(June-September) residential electricity consumption breakdown & Proportion of cooling load
.jpg)
Note: Estimated using methodology from Kim and Kang (2017); 2024 is a projection based on 10-year average cooling degree days.
Assuming average heat over the past decade, summer (June-September) residential electricity consumption in 2024 is estimated to increase by 1.8% year-on-year, with midsummer (July-August) electricity bills rising by KRW 9,000 per month for a two-person household.
Assuming a record-breaking heat wave, residential electricity consumption for the entire summer season (June-September) in 2024 is estimated to increase by 11.2% year-on-year, with midsummer electricity bills rising by KRW 26,000 per month year-on-year for a household of two.
Considering that electricity for cooling accounts for less than 25 percent of total summer electricity consumption, it is unlikely that a spike in electricity consumption for cooling during a heatwave would lead to a bill bubble.
Electric steelmaking industry and electricity demand
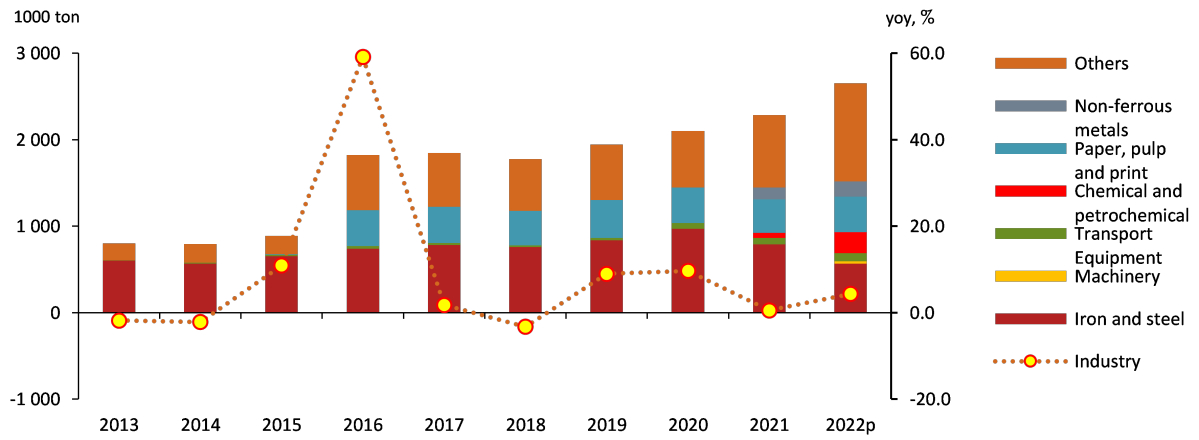
Production of electric furnace steel and construction steel products has been on a downward trend since 2022, reducing steel industry electricity consumption.
Production of electric furnace steel in the steel industry fell 5.1% y/y in 2023 to 19.68 million tons, the second consecutive year of decline after 2022 (-7.4%) and the first time it fell below 20 million tons since 2010, when the relevant statistics began to be compiled. Production in the first quarter of 2024 continued to decline, down 7.4% y/y.
Production of major steel products in electric furnaces & Steel industry electricity consumption trends
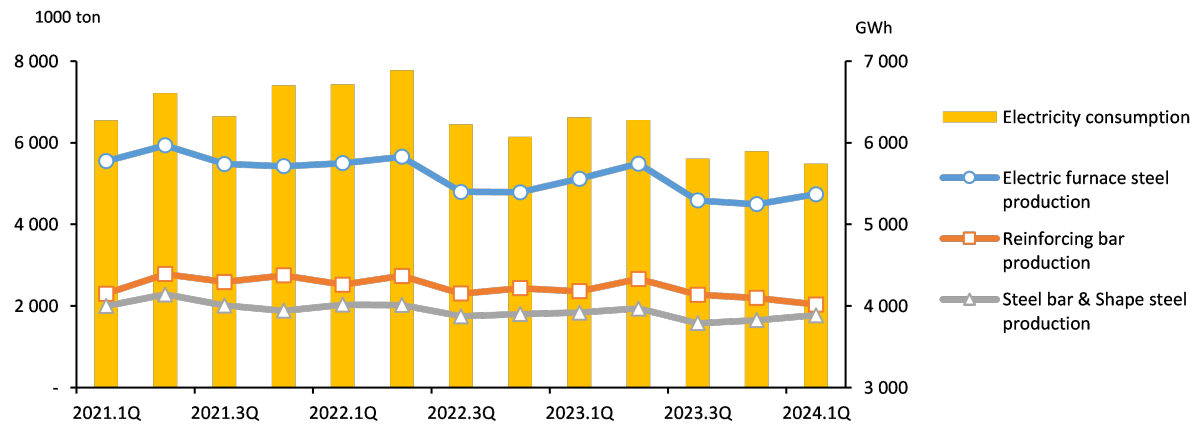
Source: Korea Iron & Steel Association
The decrease in production of electric furnace steel and steel products for construction was attributed to the excess supply of key steel products due to the slowdown in Korea's construction industry and China's economic slowdown.
Construction commencement and construction permit trends
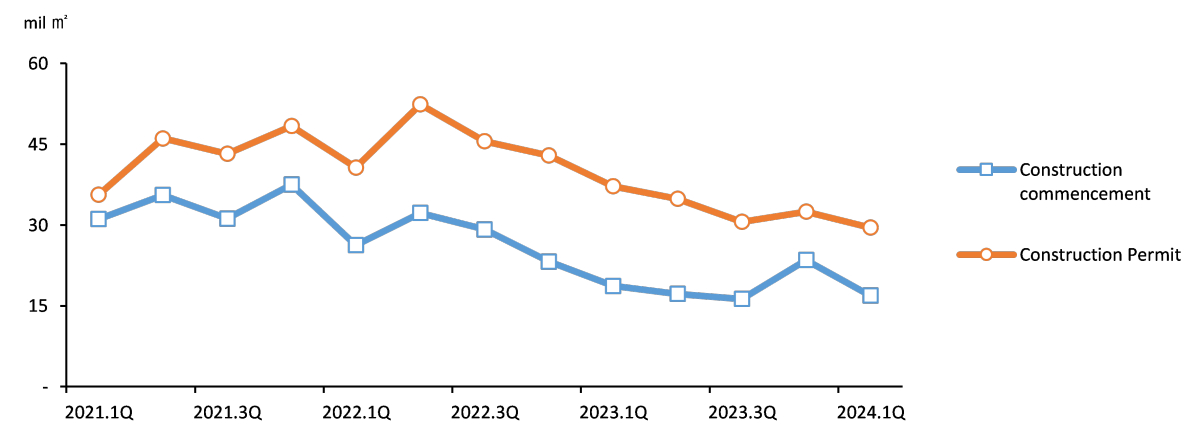
Source: Ministry of Land, Infrastructure, and Transport
Electricity consumption in the steel industry is expected to continue to decline in 2024 due to the contraction of electric furnace steel production due to the construction slowdown.
Inventories of rebar, a representative steel product, increased by 19.1% and 27.2% in 2022 and 2023, respectively, and surged by 49.9% year-on-year in the first quarter of 2024 (18.9% for steel bar and shape steel) due to sluggish demand for construction steel products and excess supply due to the construction slowdown.[1]
Rebar and steel bar & shape steel inventory trends
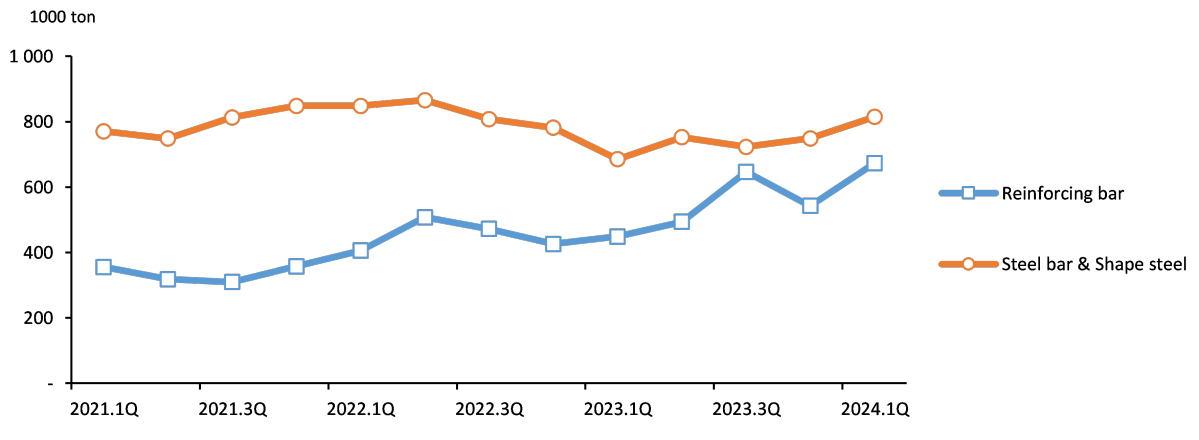
Source: Korea Iron & Steel Association
Major electric blast furnace steel producers such as Hyundai Steel and Dongkuk Steel are planning to cut production in 2024 to counter rising inventories.
Electricity consumption in the steel and non-ferrous metals industry is expected to decline by nearly 4 percent in 2024 as the downturn in the construction industry continues, leading to a decline in demand for steel products produced from electric furnace steel, such as rebar, steel bar & shape steel, and rising inventories, leading to production cuts in electric furnace steel.
[1] The distribution price of rebar reportedly fell from KRW 100.2 million per ton in December 2023 to KRW 70.5 million per ton in May 2024 due to an increase in rebar inventories (The Korea Economic Daily 2024.6.12.)
Attachments-
 2024_단기(상)_표지.jpg
Download
2024_단기(상)_표지.jpg
Download
-
Korea_Energy_Outlook_2024H1.pdf
Download
View Details
-
2024 Energy Demand Outlook (2023, Second Half)
- Date2024/01/10
- Author Department of Energy Outlook Research
- Number of downloads 29
-
Download multiple files Download the entire file
Total Primary Energy Demand and Total Final Consumption
Total Primary Energy Demand (TPED) fell by 4.0% year-on-year in 1H 2023 due to weak manufacturing activity amid the economic slowdown.
The domestic and global economic downturns that started since 2H 2022 and a consequent drop in industrial production were exacerbated in 1H 2023, and accordingly, the downward trend in energy consumption was accelerated.
Growth rate of GDP and TPED, production index
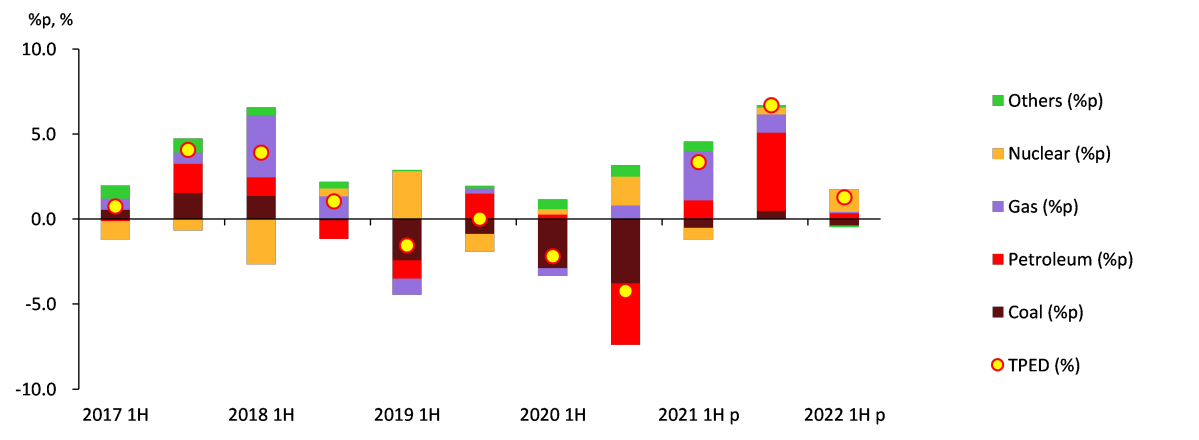
Petroleum, coal, and natural gas use fell sharply, while the use of nuclear energy remained flat, and renewable & other energy use slightly increased.
Petroleum use dropped by 5.2% year-on-year, as its industrial use plunged due to a sharp drop in petrochemical production, although it slightly increased in the transport sector.
Coal use went down by 6.3% year-on-year, as it dropped fast in the power generation sector due to transmission constraints, and it also declined in the industrial sector owing to the decreased production.
Growth rate of TPED & contributions by sources
Natural gas use fell by 6.8% year-on-year, as it declined in the power generation and end-use sectors.
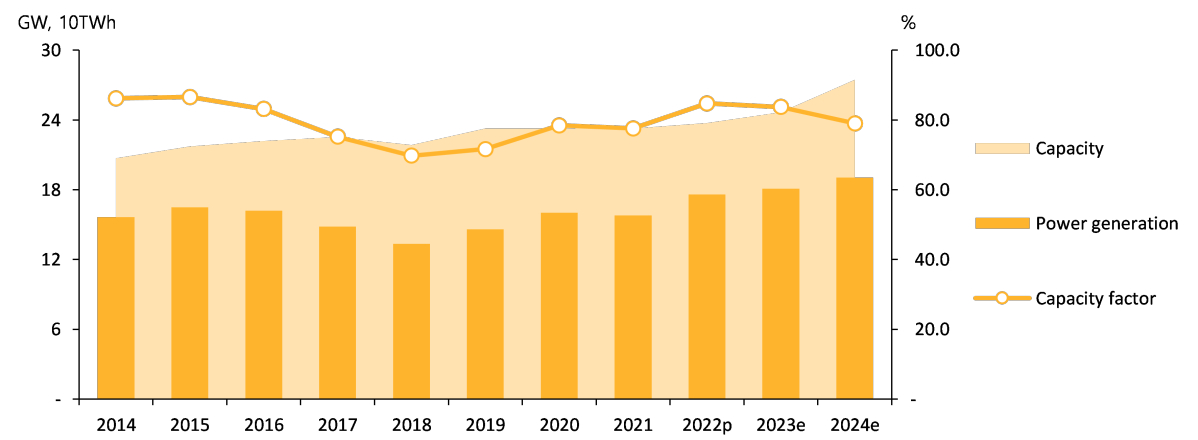
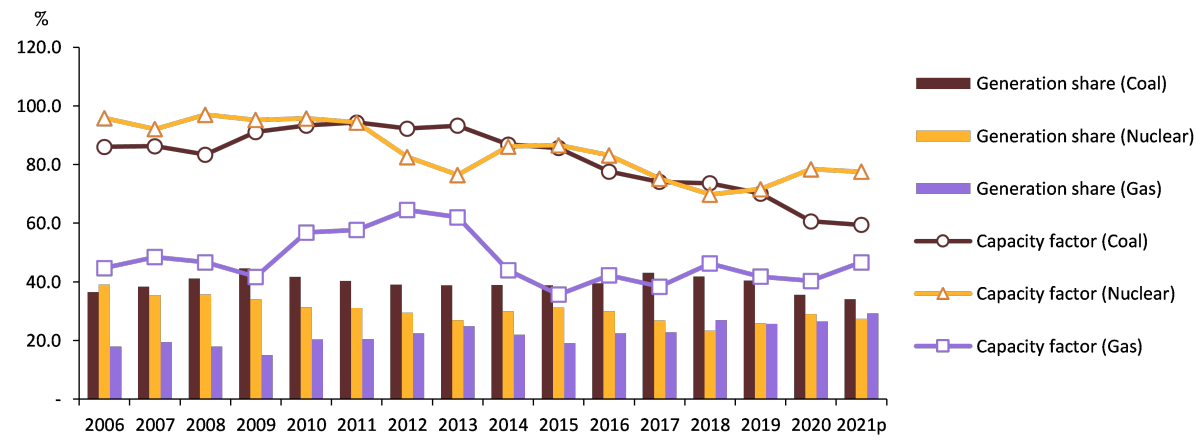
Nuclear power generation was flat on a year-on-year basis, even though the installed capacity was up 6.0% with the commissioning of a new large-scale reactor, as its capacity factor dropped by almost 5%p.
Renewable & other energy use increased (3.8%), mostly in the power generation sector, although the growth was much slower.
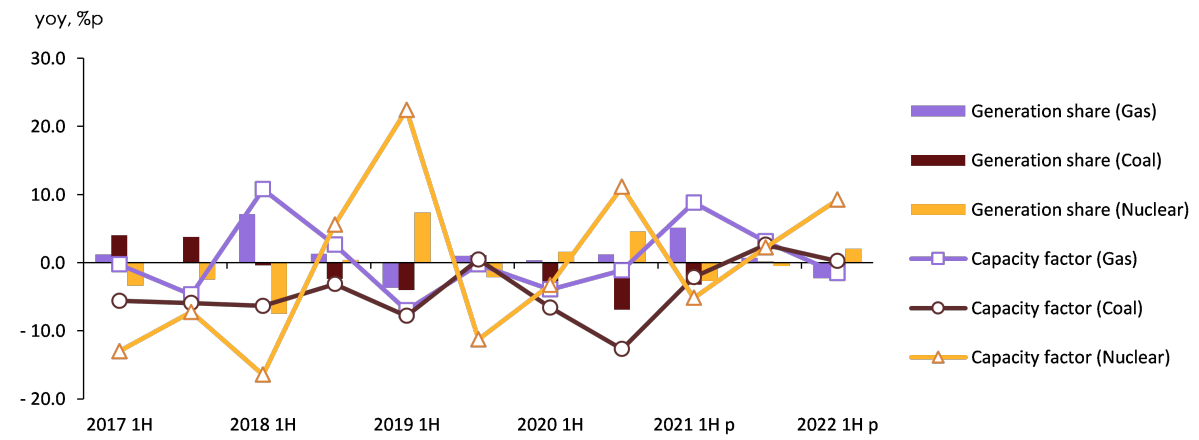
Growth rate of fuel consumption at power plants & fuel consumption trend by sources
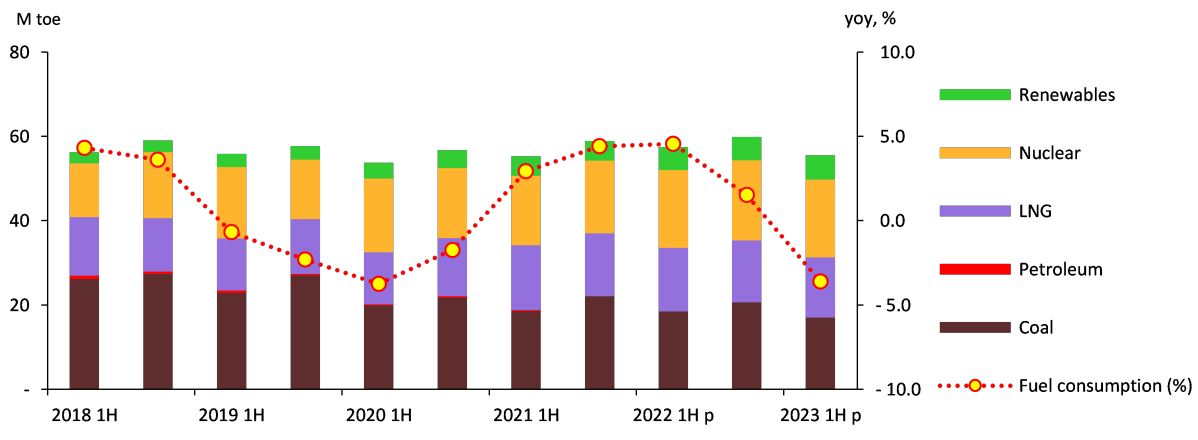
Note: Capacity factor is the ratio of actual power generation to power generation when the facility is operated at full capacity
The final use of electricity was down 0.6% year-on-year, as its industrial use declined owing to the sluggish manufacturing activity, increased captive generation and decreased number of heating degree days, and as it grew more slowly in the building sector.
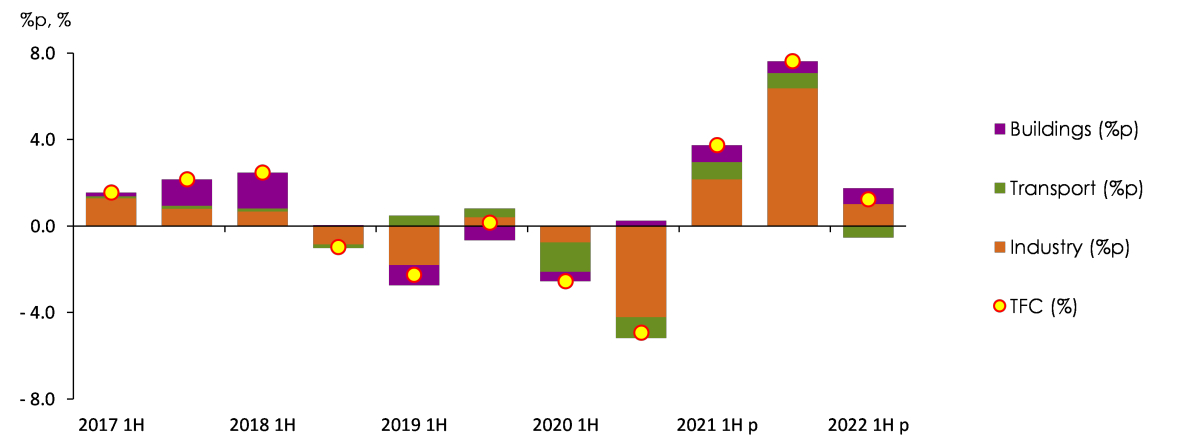
Total Final Consumption (TFC) fell by 4.6% year-on-year, as energy use plunged in the industrial and building sectors, although it increased in the transport sector.
Industrial energy use fell by 6.1% year-on-year, as it dropped rapidly in the petrochemical sector that accounts for a large share of the total industrial energy use amid an overall slowdown in manufacturing activity.
Transport energy use went up by 1.0% year-on-year, despite the overall economic slowdown, partly because domestic fuel prices declined including gasoline and diesel amid a downward trend in global oil prices.
Growth rate of TFC & contribution by sectors
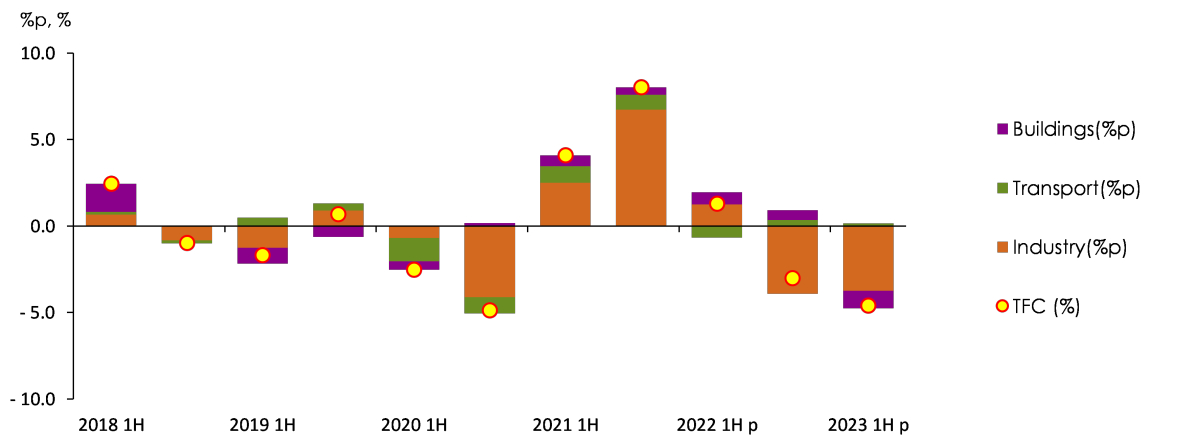
Note: Building sector includes residential, commercial, public-etc usage.
In the building sector, energy use decreased by 4.3% year-on-year, as the number of heating degree days decreased, and the heating cost crisis emerged as a social issue following the city gas rate increase at the beginning of the year.
TPED & TFC Outlook
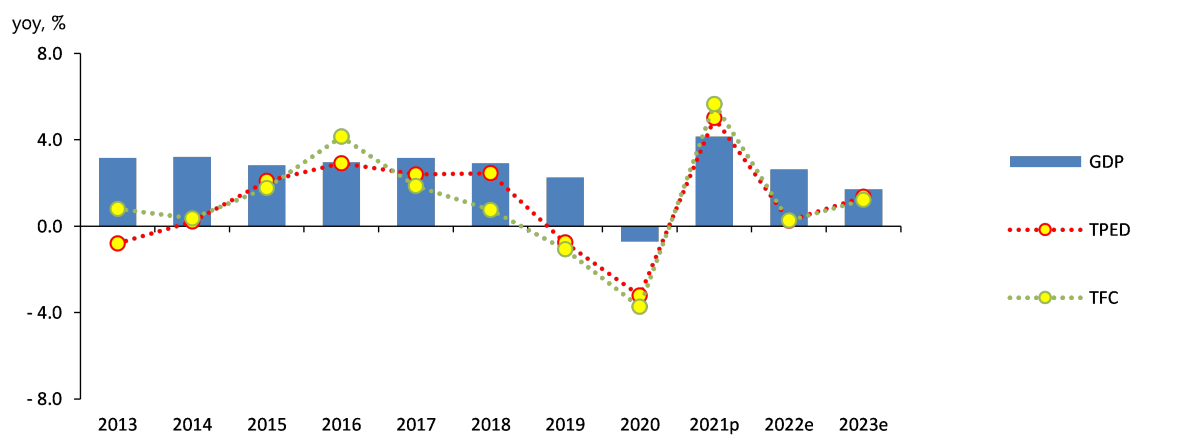
TPED is expected to drop by 2.2% in 2023, and then grow by 2.0% in 2024, reaching 305.4 Mtoe.
While TPED is expected to drop in 2023, mostly in the industrial sector due to sluggish manufacturing activity, a rebound is expected in 2024, despite weak domestic demand, as production activity picks up amid growing exports.
Growth rate of GDP, TPED and TFC, trend and outlook
In 2023, the energy intensity will rapidly improve (decline), despite the economic growth (1.4%), as energy consumption declines. In 2024, however, it is expected to improve at much slower pace, as the manufacturing sector that is highly energy intensive leads the economic recovery.
Energy intensity and EI recovery trends
Note: Energy Intensity is calculated as the value of 'TPED/GDP', expressed in toe/million won, EI recovery rate multiplies EI increase rate by '-1'.
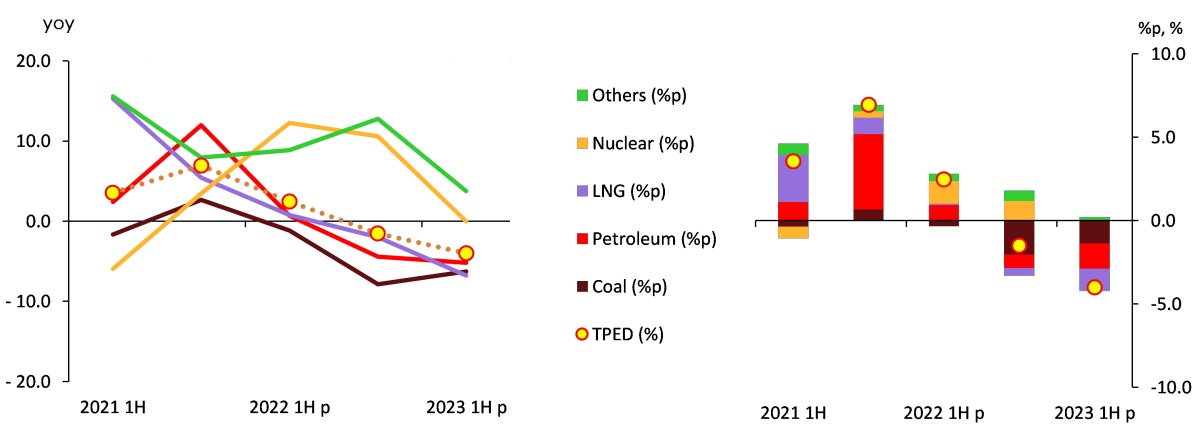
In 2023, coal, petroleum, and gas are expected to lead the downward trend in energy use. In 2024, the use of all energy sources is forecast to increase except coal.
Petroleum demand is forecast to drop by 3.6% in 2023, especially for industrial feedstock use, while it is expected to grow by 1.7% in 2024, as overall manufacturing activity picks up, and the petrochemical industry recovers to some extent.
Coal demand is forecast to drop by 4.8% in 2023, with the industrial and power generation sectors leading the downward trend. In 2024, it is expected to fall by 2.3%, although it continues to decline in the power generation sector, as industrial coal demand rebounds due to the base effect of the recent downward slide.
Nuclear generation is expected to grow by 2.7% in 2023 and 5.4% in 2024, affected by the deployment of large-scale reactors.
Natural gas demand is forecast to drop by 3.8% in 2023, as it declines in the power generation and end-use sectors all together, and then grow by 5.4% in 2024, with the demand bouncing back in each sector.
Growth rate of TPED & contributions by sources
Electricity demand in the end-use sectors is expected to be flat in 2023 compared to the previous year. In 2024, it is likely to grow by 1.7% due to a recovery in the manufacturing sector.
Energy demand in the end-use sectors is forecast to decrease by 3.0% in 2023, and then increase by 1.9% in 2024.
In the industrial sector, energy demand is expected to decline by 3.4% in 2023 due to the slump in the petrochemical industry, which accounts for a large share of the total industrial energy use, while the demand is forecast to increase by 2.3% in 2024, owing to base effect and a recovery in production activity amid growing exports.
Change and growth rate of TFC by energy sources and end-use sectors
In the transport sector, energy demand is forecast to decrease by 1.8% in 2023, driven by lower energy demand for cargo transport, but the demand growth of 0.5% is expected in 2024, as the economy recovers to some degree.
In the building sector, energy demand is projected to drop by 2.6% in 2023 due to the decreased number of heating degree days and higher energy prices, while it is forecast to increase by 1.8% in 2024 partly due to base effect and the increased number of heating degree days.
Key Features and Implications
Outlook of petrochemical industry
Demand for petroleum products that are used as petrochemical feedstock decreased owing to the petrochemical industry's deepening slump, which started in 2H 2022, and weak production.
Since 2H 2022, domestic production of petrochemical products declined, which was affected by the global economic slowdown and China's enhanced self-reliance in producing petrochemical products.
Key petrochemical indicators
Note: The numbers in parentheses indicate the rate of change compared to the previous year
Source: Korea Petrochemical Industry Association
Although the recovery of the petrochemical industry has been delayed, the industry is widely expected to pick up by the second half of 2024.
Until 1H 2023, the prevailing expectation was that the petrochemical industry would recover in the second half of the year. However, the recovery has been continuously delayed, as the oversupply issue of petrochemical products continued in the international market.
Industrial natural gas demand
Natural gas consumption by industrial sectors & consumption growth trend
Industrial natural gas use that has been stagnant due to soaring global natural gas prices is expected to grow rapidly again during the outlook period.
Industrial natural gas use had rapidly increased for the past few years, as growing number of sectors used more natural gas for captive power generation, which uses directly imported natural gas, and for combined heat and power generation in industrial sites.
Global natural gas prices & growth rates in industrial natural gas use
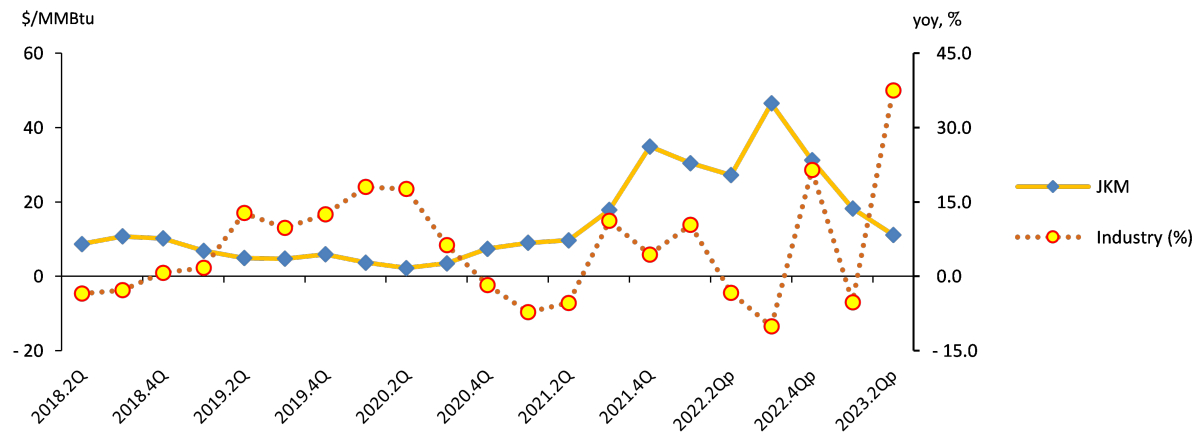
Industrial natural gas demand is expected to grow fast during the outlook period. Still, global prices could possibly cause a large change in natural gas demand.
Changes in the energy mix
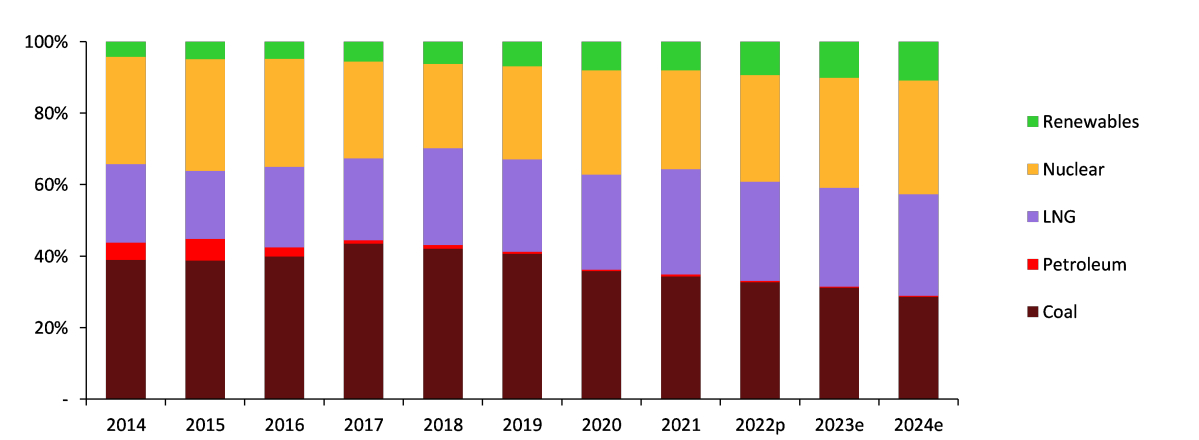
In 2024, nuclear generation is expected to regain the dominant position in the energy mix, as nuclear generation's share surpasses that of coal-fired generation for the first time since 2007.
The share of nuclear, renewable & other, and gas-fired generation is expected to increase, while that of coal-fired generation is expected to drop fast.
Changes in the energy mix by energy sources
Nuclear generation's share of the energy mix will rapidly increase during the outlook period, and the increased installed capacity will be the main contributing factor.
Nuclear installed capacity, capacity factor & power generation trends
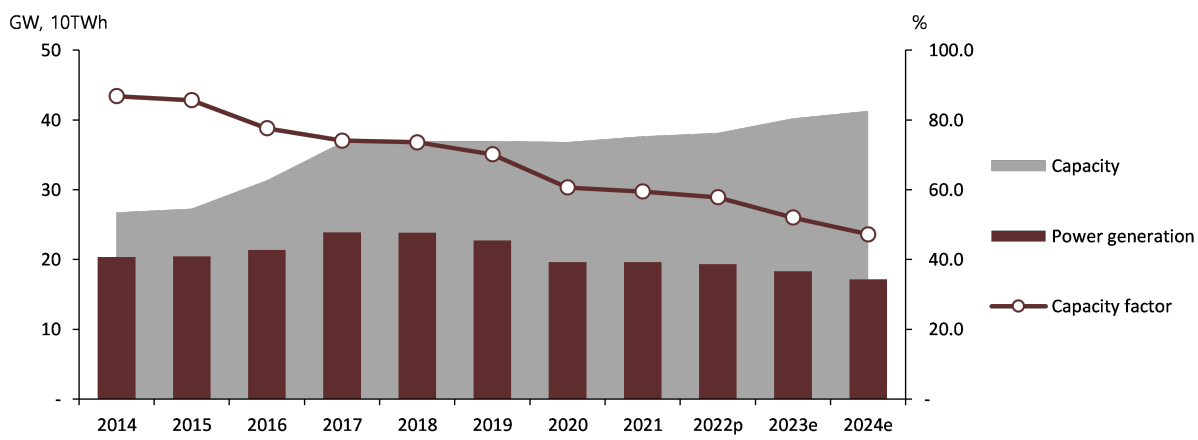
Previously, the drop in coal-fired generation's share was largely attributed to the government's fine dust and greenhouse gas emissions reduction policy. Since 2022, however, the transmission constraint issue is considered to have a larger impact.
Coal installed capacity, capacity factor & power generation trends
 Attachments
-
단기(하)_표지.jpg
Download
-
KoreaEnergyOutlook_2023H2_SecondHalf.pdf
Download
View Details
-
2023 Energy Demand Outlook (2023, First Half)
- Date2023/07/07
- Author Department of Energy Outlook Research
- Number of downloads 19
-
Download multiple files Download the entire file
Total Primary Energy Demand and Total Final Consumption
In 2022, Total Primary Energy Demand (TPED) dropped by 0.4% year-on-year to 302.0 Mtoe due to a slowdown in manufacturing production.
In the first half of 2022, energy use increased, driven by enhanced production activities in the mining & manufacturing sector. In the second half, however, energy use decreased as a result of sluggish production in the mining & manufacturing sector with the slowdown in global growth.
By energy sources, the use of nuclear energy and renewable & other energy grew by 11.4% and 11.2% year-on-year, while the use of fossil fuels such as coal, petroleum and gas fell by 5.3%, 1.9% and 1.2% respectively, and accordingly, greenhouse gas emissions are estimated to have declined than the previous year.[1]
The growth rates of GDP and TPED, production index
Note: Production indexes show year-on-year differences.
Gross Domestic Product (GDP) grew by 2.6% owing to a decent growth in production activities in the service industry that accounts for a large share of the total added values, while TPED decreased. As a result, energy intensity (toe/million won) improved(declined) by 2.9%.
In 2022, nuclear and renewable & other energy use increased, while the use of coal, petroleum and gas declined than the previous year.
Coal use fell by 5.0% year-on-year, as it declined in the power generation sector, affected by constraints on transmission lines, and its industrial use plunged, especially coking coal, due to a production loss in the iron & steel sector in the aftermath of a typhoon.
Petroleum use dropped by 1.9% year-on-year, as its use as feedstocks declined in the petrochemical sector, which takes up a large share of the total industrial petroleum use, and as it also declined in the transport sector amid falling demand for diesel in the road transport sector.
The growth rates of TPED & contributions by sources
Natural gas use slid by 1.1% year-on-year, with the power generation sector leading the downward trend, although its final use increased, especially in the building sector.
The total nuclear generation posted a year-on-year growth of 11.4% as a result of the growth in capacity factor and installed capacity. Renewable & other energy use was up 11.2%, led by the power generation sector.
The growth rates of energy use by major energy sources
Note: Capacity factor is the ratio of the electrical energy produced to the electrical energy that could have been produced at continuous full power operation.
Meanwhile, electricity use grew by 2.7% year-on-year, as it continued to grow rapidly in the building sector, although electricity use in the industry grew at slower pace mostly in the 2nd half of the year.
In 2022, Total Final Consumption (TFC) dropped by 1.1% year-on-year, as it declined in the industrial sector, which accounts for a large share of TFC, although the building sector consumed more energy.
Industrial energy use went down by 2.7% year-on-year due to weak production activities in the midst of the global economic downturn and lower iron & steel production, which was hit by a typhoon.
In the transport sector, energy use fell by 0.6%, mostly in the road transport sector, affected by high petroleum product prices, even though mobility demand increased following the termination of social distancing restrictions since April.
The growth rates of TFC by end-use sectors
Note: The Building sector includes residential, commercial and public-etc usage.
Energy use in buildings went up by 3.3%, with the commercial sector leading the growth by much stronger service production, and it was also affected by the increased number of cooling & heating degree days.
TPED & TFC Outlook
In 2023, TPED is expected to drop by 0.7% year-on-year to 299.8Mtoe.
TPED rapidly recovered from Covid-19 lows and peaked at 303.3 Mtoe in 2021. However, it is expected to decline for the second consecutive year partly due to a slowdown in economic growth.
The growth rates of GDP, TPED and TFC, trend and outlook
The total energy demand is likely to decline, led by fossil fuels including coal, petroleum and gas, while demand for zero emissions sources such as nuclear and renewable energy increases. As a result, national greenhouse gas emissions are expected to decline.
The energy intensity (toe/million won) is forecast to improve(decline) rapidly for the 2nd consecutive year in 2023, as GDP grows by 1.4%, while TPED decreases.
Energy Intensity and EI Recovery Trends
Note: Energy Intensity is calculated as the value of 'TPED/GDP', expressed in toe/million won, EI recovery rate multiplies EI increase rate by '-1'.
While the demand for nuclear and renewable energy is expected to increase, fossil fuels such as coal, petroleum and gas are likely to lead the downward slide in energy demand.
Coal demand is projected to drop by 2.5% year-on-year, as it declines in the power generation sector due to power grid constraints, although its industrial demand is expected to grow compared to the previous year with the iron & steel production returning to normal operations.
Petroleum demand is forecast to decrease by 1.8% year-on-year despite slightly increasing demand in the transport sector, as its industrial demand decreases, especially for use as petrochemical feedstocks.
Natural gas demand is expected to drop by 0.8% year-on-year, although it slightly increases in the power generation sector, as city gas demand decreases, mostly in the building sector.
The growth rate of TPED & contributions by sources
Nuclear generation is expected to grow by 2.6% as a result of the commissioning of a new reactor and increased capacity factors. Renewable & other energy generation is also forecast to grow by 10.3% due to a steady increase in installations.
Electricity demand is likely to grow by mere 0.5% year-on-year in the end-use sectors, as the demand remains flat in the industrial sector, while it declines in the residential sector, although it grows by more than 1% in the commercial sector.
TFC is projected to drop by 0.9% year-on-year (in 2023), with the industrial and building sectors leading the downward slide, though transport energy use is expected to increase.
Industrial energy demand is expected to drop by 1.0% amid the overall slowdown in production activities, as especially demand for LPG and naphtha-petrochemical feedstocks that takes up a large share of the industrial energy demand-is expected to rapidly decline.
The change and growth rate of TFC by energy sources and end-use sectors
Transport energy demand is expected to grow by 0.6% year-on-year, affected by stable fuel prices and growing mobility demand.
Energy demand in buildings is projected to decline by 1.7% year-on-year, as consumer sentiment slides due to higher energy rates, and the number of cooling & heating degree days decreases.
Key Features and Implications
In 2023, energy use is predicted to decline, largely driven by a drop in energy use as petrochemical feedstocks as well as lower energy demand in the building sector.
In 2023, the industrial sector is expected to make the largest contribution to the decline in energy use, and by the types of industries, it will be affected most by lower feedstock energy use in the petrochemical sector, which accounts for a large share of the total industrial energy use.
In the building sector, energy use is expected to plunge due to weak consumer sentiment that was hit by the heating cost crisis at the beginning of the year and price & temperature effect, which will be the main factor of a decline in the total energy demand.
In the power generation sector, the total generation will decrease to the pre-2010 level, as coal-fired power generation steadily declines due to transmission constraints, while the power generation from nuclear and renewable energy increases.
This section explains key features of the outlook, listed above.
Demand for petroleum products used as petrochemical feedstocks
Since the 2nd half of 2022, petrochemical production declined, as its exports and domestic demand decreased amid the global economic slowdown.
During the covid-19 pandemic (2021-1st half of 2022), domestic production of petrochemical products was solid in line with growing demand. Since the 2nd half of 2022, however, production declined amid the global economic downturn and weak demand from China.
Production, export and domestic consumption of three major petrochemical products
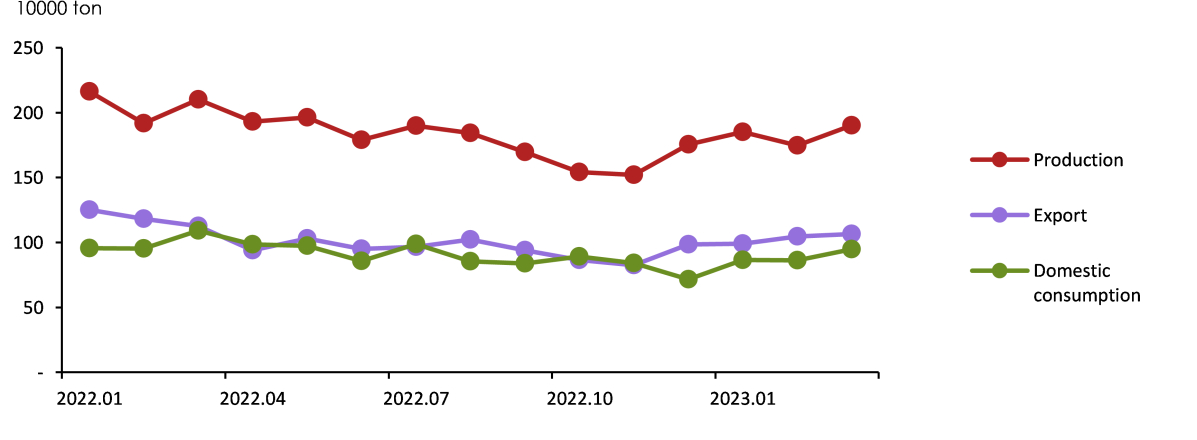
Note: The three major petrochemical products are synthetic resin, synthetic fiber raw materials and synthetic rubber.
Source: Korea Petrochemical Industry Association, Statistics on production & sales (2023.6.19)
In the petrochemical sector, demand for petroleum products used as feedstocks such as naphtha and LPG dropped fast due to weak production.
The use of naphtha and LPG, which are petrochemical feedstocks, decreased by 7.6% year-on-year in the first quarter of 2023.
Relative price of propane in terms of naphtha (major petrochemical feedstocks)
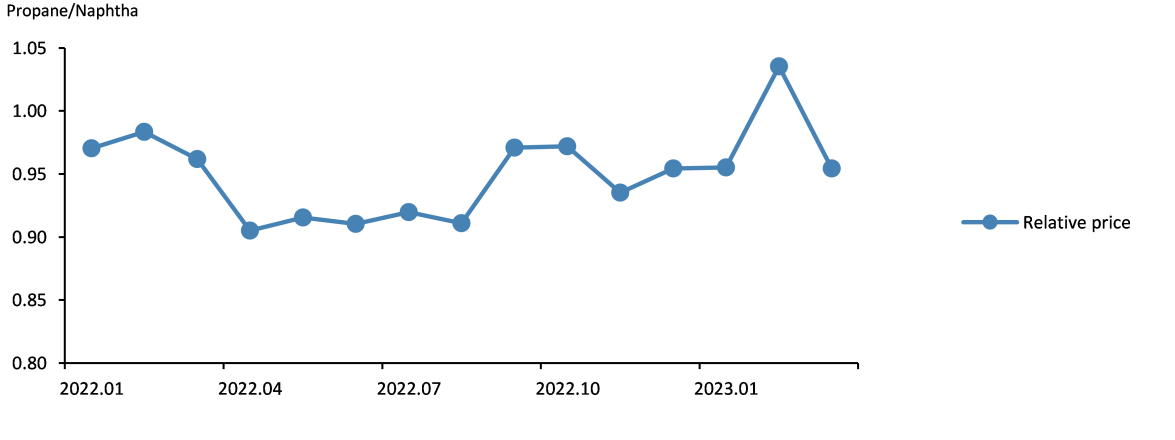
Note: It is the price of propane when naphtha price is assumed to be 1 (based on weight).
Source: Korea International Trade Association, data on volume and value of import (2023.6.19)
While demand for petroleum products used as petrochemical feedstocks declined amid a drop in petrochemical production, LPG demand dropped faster compared to naphtha due to a surge in LPG Contract Price (CP), which is the global price benchmark.
Heating cost crisis and buildings' energy demand
Heat Wave Scenario
The heating cost crisis, which occurred early this year, raised consumers' sensitivity to energy costs in the building sector, contributing to the decline in energy demand.
Domestic energy prices increased amid the global energy price hikes last winter, and the number of heating degree days drastically increased in December. Consequently, a steep rise in heating costs emerged as a social issue.
The number of times "heating cost" appeared on the internet news sites and blogs, 2022.12.1-2023.3.31
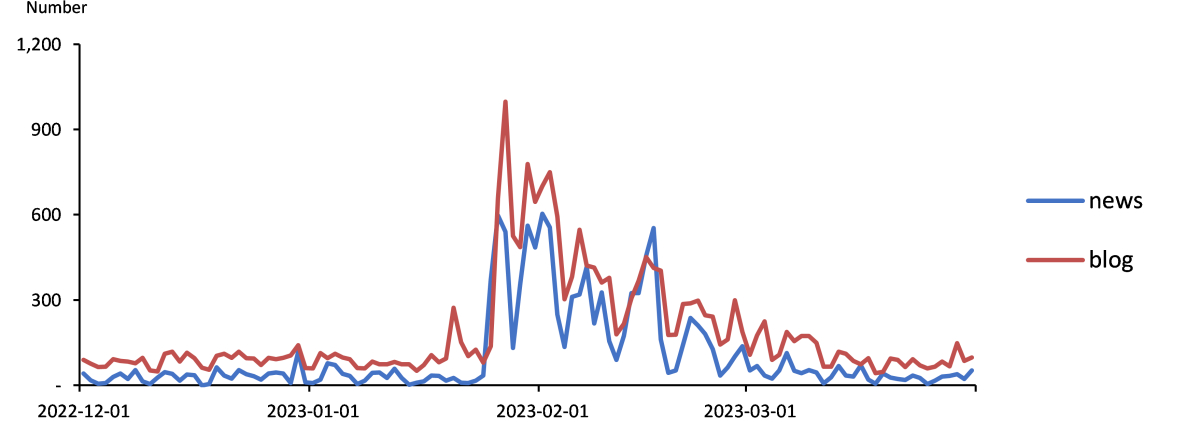
Source: The graph was drawn by the author of this report using the data derived from keywords trend analysis of big data platform, owned by National Research Council for Economics, Humanities and Social Sciences (https://www.nrcdata.re.kr/nrc/usr/main.do).
As heating cost crisis emerges as a social issue, general households and small business owners' sentiment for energy use fell sharply, and most of the energy rates including electricity, city gas and heat energy increased from the previous year, which will lead to a decline in buildings' energy demand.
In addition to higher energy rates, the number of cooling & heating degree days, which is the most important factor of the growth and decline in buildings' energy use, drastically decreased, and these factors are expected to accelerate the decline in buildings' energy demand.
In this outlook, energy use in buildings is projected to drop by 1.7% in 2023, contributing (-0.4%p) to the downward trend in TFC (-0.9%).
Transmission constraints and power generation mix
Coal-fired power generation is predicted to drop fast due to transmission constraints amid growing renewable and nuclear power generation.
Recently, new generation facilities have been rapidly increasing, while the construction of transmission infrastructure is being delayed partly due to a lack of consensus in local communities, exacerbating constraints on transmission lines connecting the east coast & Honam areas and the metropolitan area.
Monthly baseload generation trend since 2020 (including renewable energy)
Amid growing renewable and nuclear power generation, such transmission constraints are causing a drop in coal-fired power generation that is given a lower priority than renewable and nuclear energy when generating electrical power.
Comparison of power generation mix, 2017 vs 2023
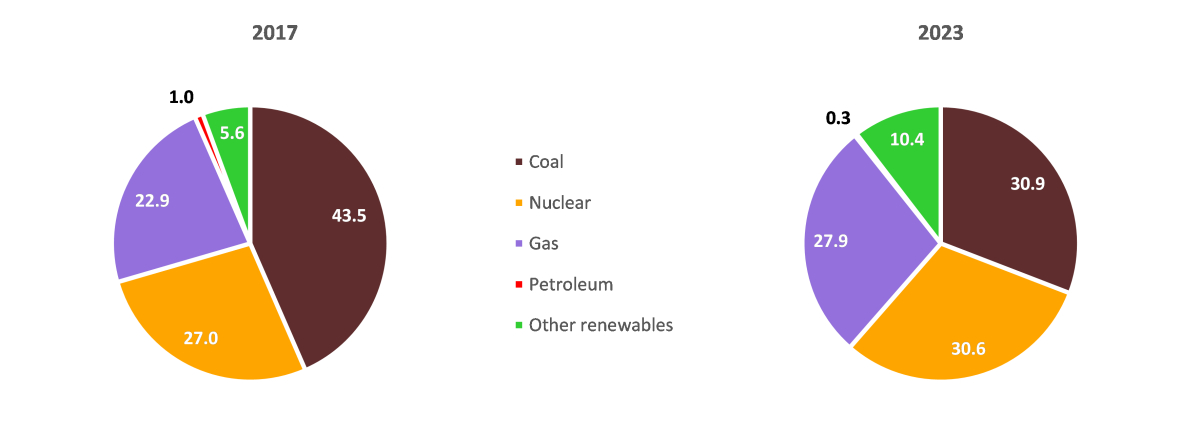
Note: 2023's power generation mix by energy sources was compared with that of 2017 when coal accounted for the largest share of the total power generation during the past decade.
This outlook predicted power generation by energy sources, considering the fact that transmission infrastructure is the same as the previous year in 2023, and assuming this year's baseload generation (including nuclear energy) is at a level similar to 2022.
[1] The statistics on greenhouse gas emissions are published biennially, and the data of 2021 is the latest available statistics as of April 2023.
Attachments-
단기(상)_표지.jpg
Download
-
KoreaEnergyOutlook_2023H1_FirstHalf.pdf
Download
View Details
-
2023 Energy Demand Outlook (2022, Second Half)
- Date2023/01/31
- Author Energy Outlook Research Team
- Number of downloads 21
-
Download multiple files Download the entire file
Total Primary Energy Demand and Total Final Consumption
Total Primary Energy Demand (TPED) went up by 1.3% year-on-year in 1H 2022, as production activities continued to recover from COVID-19 disruptions to some extent.
Energy consumption grew, as production activities continued an uptrend in the manufacturing and service sectors following last year's recovery, though the pace of growth was limited by higher energy prices amid the Russia-Ukraine conflict.
Growth rate of GDP and TPED, production index
The use of nuclear energy surged, and that of petroleum and gas slightly increased, while coal and renewable & other energy use declined a bit.
Petroleum use grew by 1.2% year-on-year, led by the industrial sector, which accounts for a major portion of the total petroleum use, following the construction of additional petrochemical facilities, although it declined in the transport and building sectors due to higher prices.
Coal use fell by 1.4% year-on-year, as its industrial use declined, especially in the steelmaking sector, although it slightly increased in the power generation sector.
Growth rate of TPED & contributions by sources
Natural gas use rose by 0.3% year-on-year, as it grew decently in the city gas production sector, though it declined in the power generation sector owing to a surge in nuclear generation and soaring global natural gas prices.
The total nuclear generation was up 12.3% year-on-year, as the capacity factor went up by over 9%p compared to the same period last year, though the total installed capacity remained the same.
Capacity factor and Generation share of major sources<4 >
Note: Capacity factor is the ratio of actual power generation to power generation when the facility is operated 100%.
Meanwhile, the final electricity use posted a year-on-year growth of 3.9%, as production activities rapidly increased in the manufacturing and service sectors, and the number of heating degree days rose sharply, especially in the 1st quarter.
Total Final Consumption (TFC) increased by 1.2% year-on-year in 1H 2022, with the industrial and building sectors driving the growth, although it declined in the transport sector.
Industrial energy use grew by 1.7% year-on-year, as production activities grew quite strongly in the overall manufacturing sector in addition to a sharp increase in the use of petrochemical feedstock, which takes up a large part of the total industrial energy use.
Transport energy use dropped by 3.2% year-on-year, despite the termination of social distancing measures of COVID-19, because fuel prices increased such as gasoline and diesel.
Growth Rate of TFC & Contribution by Sector<4 >
Note: The building sector includes residential, commercial, public-etc usage.
Energy use in buildings posted a year-on-year growth of 3.2%, as it grew in both of the residential and commercial sectors amid the increased number of heating degree days and stronger service production as a result of the termination of all the social distancing rules.
TPED & TFC Outlook
TPED is expected to grow by 0.3% in 2022 and 1.3% in 2023, reaching 309.0 Mtoe.
In 2022, TPED is likely to grow much slowly compared to the economic growth rate due to disruptions to steel manufacturing in the aftermath of a typhoon, lower utilization rates at petrochemical facilities and a surge in energy prices. In 2023, however, TPED is expected to grow faster, as the contributing factors to the slower TPED growth in 2022 have less effect in 2023.
Growth rate of GDP, TPED and TFC, trend and outlook
The energy intensity (toe/million won) is expected to improve (drop) rapidly in 2022. In 2023, however, the rate of improvement will be much slower.
Energy Intensity and EI Recovery Trends
Note: Energy Intensity is calculated as the value of 'TPED/GDP', expressed in toe/million won, and EI recovery rate multiplies EI increase rate by '-1'.
In 2022 and 2023, nuclear and renewable & other energy are forecast to lead the growth in energy demand, while gas and petroleum demand steadily declines.
Petroleum demand is forecast to slightly decrease in 2022 and 2023, as petrochemical facilities operate at much lower utilization rates, although it is likely to increase until 1H 2022, led by the industrial sector.
Coal demand is projected to fall by 3.0% in 2022, mostly in the industrial sector, while it is expected to increase by around 2% in 2023.
Nuclear generation is forecast to grow by 14% in 2022 and 5% in 2023, the capacity factor and the total installed capacity increases.
The growth rate of TPED & contributions by sources
Natural gas demand is expected to fall for two consecutive years of the outlook period, as it declines in the power generation sector due to global natural gas price hikes and the construction of additional baseload power plants, driving natural gas demand down, and as city gas demand grows at slower pace.
The final electricity use is likely to grow fast until 2022, continuing the recovery from COVID-19 disruptions. Meanwhile, it is projected to grow in the mid 1% range in 2023, as production activities in industry slow down amid the domestic and global economic slump.
In the final consumption sector, energy demand is forecast to grow by 0.3% in 2022 and 1.2% in 2023.
In 2022, industrial energy demand is forecast to drop by 0.4% due to production delays in the iron & steel sector as a result of a typhoon and lower utilization rates at petrochemical facilities. In 2023, however, it is expected to rebound by low 1%, as production activities recover, especially in the second half of the year.
Change and Growth rate of TFC by energy sources and end-use sectors
Transport energy demand is projected to fall by 1.3% in 2022 partly due to higher petroleum products prices, while it is expected to bounce back a little in 2023, as prices decline, and mobility demand slowly recovers from COVID-19.
Energy demand in buildings is forecast to grow by 3.3% in 2022, affected by temperature conditions and the recovery of the service industry. In 2023, however, the demand growth is expected to slow down to the low 1% range partly due to a drop in the number of cooling & heating degree days.
Key Features and Implications
This is the first outlook report that was written based on the data from the revised Energy Balance.
The old Energy Balance had been in place since the 1980s, but it had its limitations in fully reflecting the current structure of energy consumption and supply. Accordingly, it went through years of updating process, and the revised Energy Balance was designated as the nationally authorized statistics in October 2022, replacing the old version.
This is the first outlook report that was produced based on the revised Energy Balance. This section briefly explains the difference between the old and revised Energy Balance and the noteworthy points in analyzing figures in this outlook report.
Transformation Processes
The transformation process refers to the production of secondary energy products (electricity, heat, city gas etc.) from the primary energy products (coal, natural gas, petroleum etc.). The structure of revised Energy Balance was modified as shown in the table below (Table 3.1).
Comparison of the Transformation processes in the old and revised Energy Balance
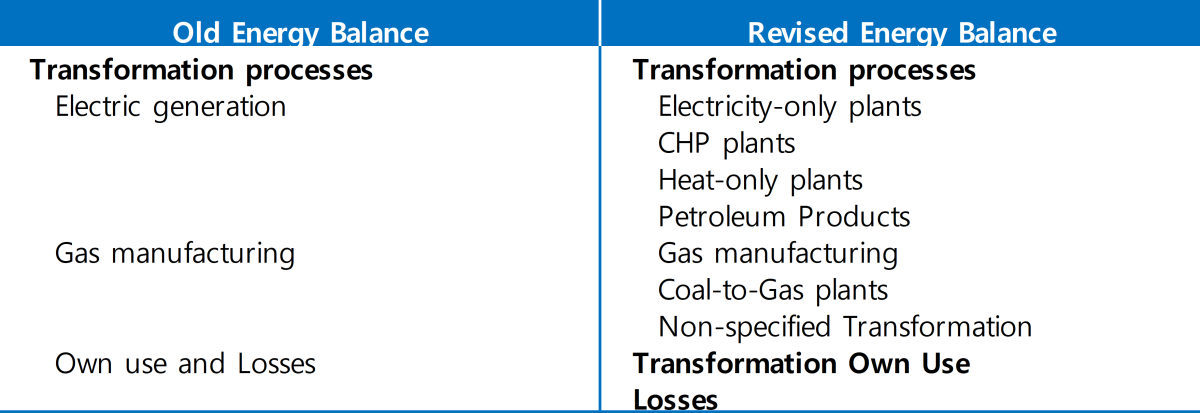
"Electric generation" and "district heating" in the old Energy Balance, which are related to electricity and heat producton, were subdivided into the categories of "Electricity-only plants", "CHP plants[1]" and "Heat-only plants" in the revised Energy Balance.
Since Pumped-storage hydroelectricity generation was excluded in the revised Energy Balance, the total electric generation figures suggested in the revised Energy Balance are different from those of Korea Electric Power Corporation(KEPCO).
The revised Energy Balance added "petroleum products manufacturing" as a new category within the transformation processes.
"Gas manufacturing" refers to the transformation process of gasifying LNG into city gas, which was the same as in the old Energy Balance.
In addition, the Integrated Gasification Combined Cycle(IGCC)'s gas and hydrogen manufacturing were subdivided into "coal-to-gas manufacturing" and "non-specified transformation".[2]
"Own use and Losses" in the old Energy Balance was further divided into the two categories of "Transformation own use" and "Losses" in the revised Energy Balance. "Transformation own use" includes some of the industrial energy use in the old Energy Balance.
Comparison of Petroleum in the old and revised Energy Balance
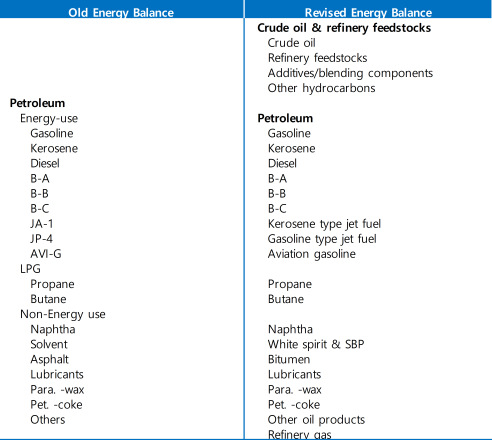
Petroleum
In the revised Energy Balance, as petroleum products manufacturing was included into the transformation processes, energy products were placed in a different structure as in the table above, including the new category of "Crude oil & refinery feedstock".
Among all energy sources, the biggest statistical change was seen in the petroleum category of the revised Energy Balance, as petroleum products manufacturing was included into the transformation processes, and the statistical standards for international bunkering were changed.
The revised Energy Balance compiled the data on crude oil & refinery feedstock inputs, petroleum products output and energy consumption and losses during the transformation process including oil refining, as petroleum products manufacturing was included into the transformation processes.
Transportation sector changed to not include International Bunkering. It includes only consumption of Rail, Road, Domestic Navigation and Domestic Aviation.
This report does not provide an outlook of primary energy consumption by petroleum products to avoid any confusion that could be caused when such consumption is negative. Instead, it only provides the outlook result on the final use of petroleum products.
Gas
In revised Energy Balance, the most distinct feature regarding gas is that the oil refining sector's natural gas and city gas use was excluded from the final energy use and classified as the transformation sector's own use, as the "Transformation own use" category was newly added.
In the old Energy Balance, the final use of natural gas (LNG) represented the use of directly imported natural gas, but in addition to that, other categories were also added in the revised Energy Balance.
Coal
In the revised Energy Balance, the types of bituminous coal were subdivided into more categories and businesses that consume anthracite were more specific than the old Energy Balance. See the table below (Table 2.3) for the subdivided types of coal in the revised Energy Balance.
Comparison of Coal in the old and revised Energy Balance
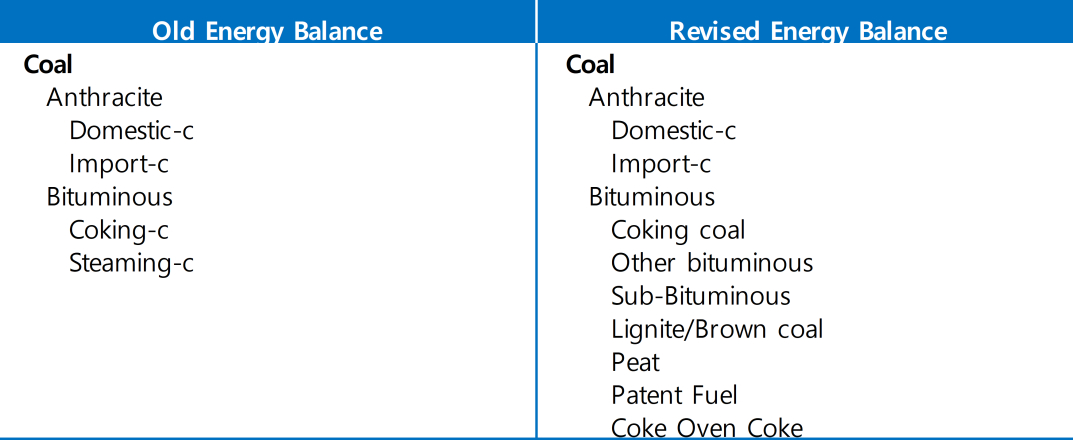
The revised Energy Balance provides detailed coal products consumption data, suggesting more types of coal and the use of each coal product by subdivided sectors and businesses.
In the old Energy Balance, coal consumption in the iron & steel sector, which is a large coal consumer, only represented coking coal consumption. In the revised Energy Balance, the data is complied across three categories, i.e., coking coal, other bituminous coal and imported anthracite.
[1] CHP plants are used for integrated energy industries, which is divided into 1) district heating, 2) industrial complex and 3) district heating-industrial complex combined. In the revised Energy Balance, CHP only includes the data on district heating, while fuel input for industrial complex and the combined category are regarded as final consumption by each type of business in the industrial sector.
[2] These two categories were created in preparation for the further expansion of the relevant flieds and more clarified statistics, because they involve some limitations for now, as the amount of coal input cannot be estimated in the "coal-to-gas manufacturing" category, and the output exceeds the input in "non-specified transformation" category.
Attachments-
단기(하)_표지.jpg
Download
-
KoreaEnergyOutlook_2022H2_SecondHalf.pdf
Download
View Details
-
Energy Demand Outlook (2022, First Half)
- Date2022/06/30
- Author Energy Demand and Supply Research Team
- Number of downloads 20
-
Download multiple files Download the entire file
Total Primary Energy Supply and Total Final Consumption
The Total Primary Energy Supply("TPES") increased by 4.5% year-on-year to 305.3 Mtoe in 2021 with the recovery of economic activities.
TPES grew at the fastest rate since 2011 (4.9%), as exports and domestic demand increased amid the rapid economic recovery at home and abroad, which led to the growth in production activities of the manufacturing and service sectors.
The growth rates of GDP and TPES, production index
Note: Production indexes show year-on-year differences.
The use of almost all energy sources increased except nuclear energy, and the increase was mostly led by petroleum and gas.
Petroleum use rose by 6.9%, which was driven by growing industrial energy use, especially those used as feedstock, owing to the economic recovery and the construction of additional petrochemical facilities, although the growth in transport energy use was stagnant due to the impact of COVID-19.
Coal use remained flat at the previous year's level, despite the decent growth in industrial coal use, as it declined in the power generation sector.
The growth rate of TPES & contribution by sources
Natural gas use went up by 8.7% year-on-year, as it surged in the power generation sector due to the increased electricity demand and decreased base load generation, and as it also grew decently in the city gas production sector.
Nuclear generation fell by 1.4% without any change in its installed capacity, as nuclear capacity factor slightly decreased.
Renewable and other energy use increased by 5.8%, partly due to the government policies that encourage the deployment of renewable installations.
Capacity factors by energy sources and power generation mix
Note: Capacity factor is the ratio of the electrical energy produced to the electrical energy that could have been produced at continuous full power operation.
Electricity use rose by 4.7% year-on-year, led by the industrial and building sectors; industrial electricity use grew rapidly with stronger production activities; buidlings' electricity use increased due to the cold spell at the beginning of the year, increased cooling demand during the summer and the recovery of the service sector.
The Total Final Consumption("TFC") grew by 5.4% year-on-year in 2021, led by a surge in the industrial sector, which accounts for a large share of TFC, although transport energy use remained stagnant.
Industrial energy use jumped 7.3%, as domestic demand and exports rose fast amid the economic recovery at home and abroad, which led to the increased production in the manufacturing sector, especially large-energy consuming businesses.
Transport energy use only slightly increased by 0.9%, despite the 1.4% growth in the road transport sector, as it declined in other transport sub-sectors.
The growth rate of TFC by end-use sectors
Note: The building sector includes residential, commercial, public-etc usage
Energy use in buildings posted a year-on-year growth of 3.8%, as it increased in both of the residential and commercial sectors due to the cold spell at the beginning of the year, increased cooling demand during the summer and the stronger service production.
TPES & TFC Outlook
TPES is expected to grow by 2.9% year-on-year in 2022 to reach 314.0 Mtoe.
Since the onset of the COVID-19 pandemic, TPES has been recovering rapidly, posting two consecutive years of growth, and in 2022, it is likely to exceed the previous peak seen in 2018.
The growth rates of GDP, TPES and TFC, trend and outlook
The rate of TPES growth is expected to be similar to that of the economic growth, and accordingly, energy intensity (toe/ KRW 1 million) will remain at the previous year's level.
Energy Intensity and EI Recovery Trends
Note: Energy Intensity is calculated as the value of 'TPES/GDP', expressed in KRW 1 million, EI recovery rate multiplies EI increase rate by '-1'.
Nuclear energy, petroleum and renewable energy will contribute the most to the growth in TPES this year, while gas use is expected to decline especially in the power generation sector.
Petroleum demand is forecast to grow by around 3%, despite the recent oil price hike, partly because the amount of petroleum used as feedstock increases amid the economic recovery from COVID-19 shocks and following the construction of additional petrochemical facilities.
Coal demand is set to rebound, despite the stagnant growth in industrial coal use, which was hit by the supply chain crisis, as its demand increases in the power generation sector as a result of the slightly eased restriction on coal-fired generation amid the recent natural gas price hike.
Nuclear generation is projected to increase by over 10%, leading the growth in TPES, along with the increased capacity factors than last year and following the commissioning of new reactors.
Natural gas demand is expected to drop in the mid-2% range, as it decreases in the power generation sector due to the unprecedentedly high global natural gas price, and as it remains flat in the city gas production sector at the previous year's level.
Final electricity demand is expected to reach 550TWh, marking the second consecutive year of fast recovery, after it declined from 2019 to 2020 due to temperature effect and the COVID-19 outbreak.
The growth rate of TPES & contribution by sources
Final energy demand by end-users is expected to grow by 2.4% year-on-year to 240.3 Mtoe in 2022.
Industrial energy demand is forecast to grow by mid-2% amid a strong economic growth, though there are some factors that could increase uncertainties in this outlook, such as the global economic slowdown triggered by the supply chain crisis.
The change and growth rate of TFC by energy sources and end-use sectors
Domestic and global travel demand is showing signs of recovery as the COVID-19 pandemic is subsiding. The growth in energy demand, however, is expected to be limited, affected by soaring gasoline and diesel prices amid the Russian-Ukraine War.
Buildings' energy demand is expected to grow at the rate of the early 2% on a year-on-year basis due to temperature effect and the recovery of the service sector from the COVID-19 crisis.
Key Features and Implications
Energy Supply Chain Crisis
Global energy prices are expected to remain high during the outlook period amid the energy supply chain crisis.
Global oil price had shown a strong upward move in 2H 2021, as the global economy started to recover from the COVID-19 pandemic. Since then, however, uncertainties surrounding the future oil prices have increased due to a potential global economic recession triggered by the Russian invasion of Ukraine in February 2022.
International Oil Price Forecast Dot Plot (US$/bbl)
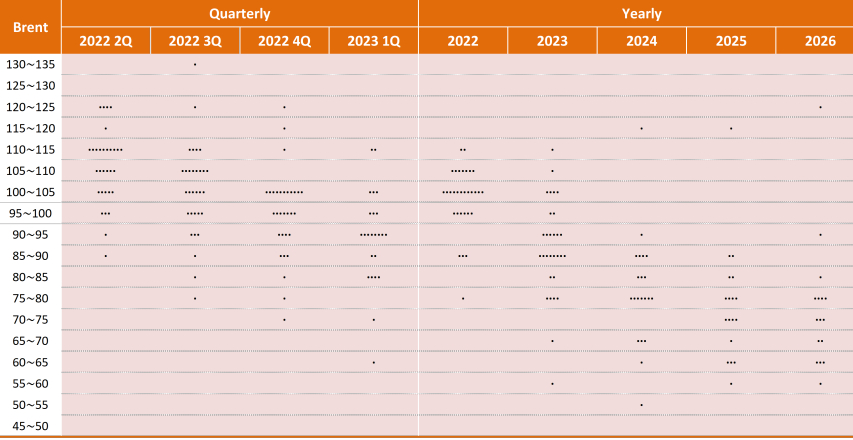
Source: Refinitiv Eikon, "Reuters Commodity Polls"(2022.4.29)
A group of experts reached a consensus on an expectation that oil prices will remain high until 2023 and then stabilize at low level.
In a shor-term, global oil prices will be largely affected by the Russian-Ukraine war, sanctions on Russia and the pace of the global economic recovery. In the mid- & long-term, the progress in energy transition will be a major factor that determines the oil price trend. For instance, if demand for and supply of fossile fuels decline at the same time throughout the energy transition process, it will have a limited impact on oil prices, while in the case of a demand-supply imbalance, oil price could fluctuate more significantly.
International nternational Energy Price Trend
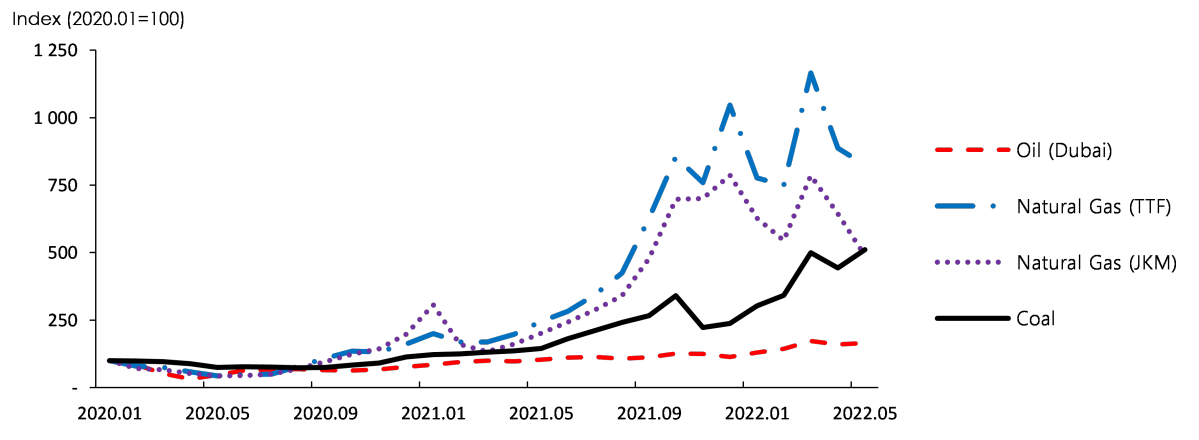
Global natural gas and coal prices surged after Russia invaded Ukraine(2022.2.24) and then showed some downward trends, but the prices are expected to remain high compared to the previous year due to growing uncertainties amid the prolonged Russia-Ukraine crisis.
The drop in TFC is likely to be limited, despite the sharp increase in global energy prices.
Domestic energy prices could face an upward pressure due to soaring global energy prices. However, the price increase will be limited thanks to the government policies aimed at stabilizing prices and reducing the burden on people, and consequently, general consumers' energy use is not expected to rapidly decline.
As mentioned above, soaring global energy prices will have only limited impact on domestic energy use. However, if inflation continues to rise worldwide, and austerity measures, that are taken as a response, lead to the economic recession, the production may slow down especially in the industrial sector, which could possibly decrease energy demand.
Heat Wave Scenario
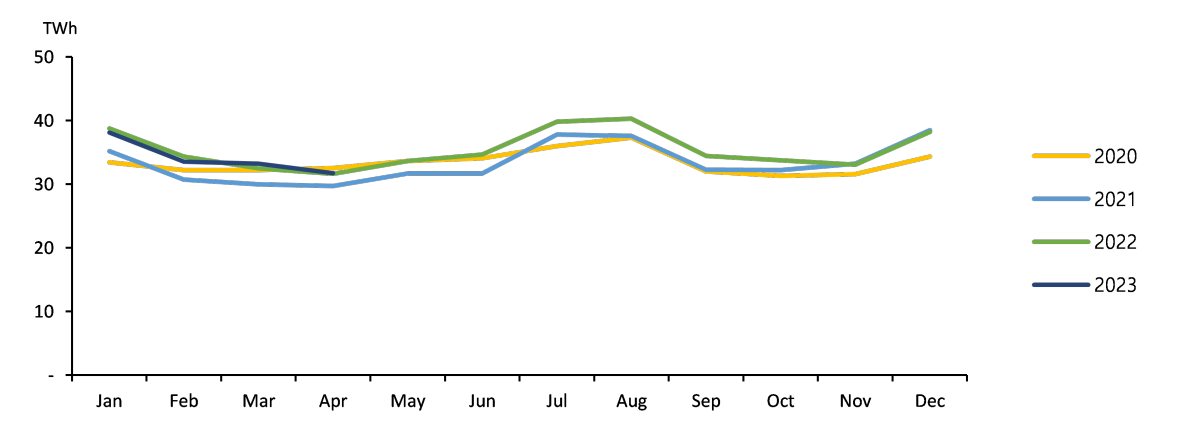
Electricity demand and supply emerged as a major energy issue for this summer, as a hotter than usual summer is expected.
Since the extremely hot summer in 2016 and 2018, concerns intensify over scorching heat every summer, and how to respond to growing power demand for cooling is discussed as a major issue of energy demand and supply.
Electricity consumption trend in the building sector in summer (Jul-Sep) and cooling degree days
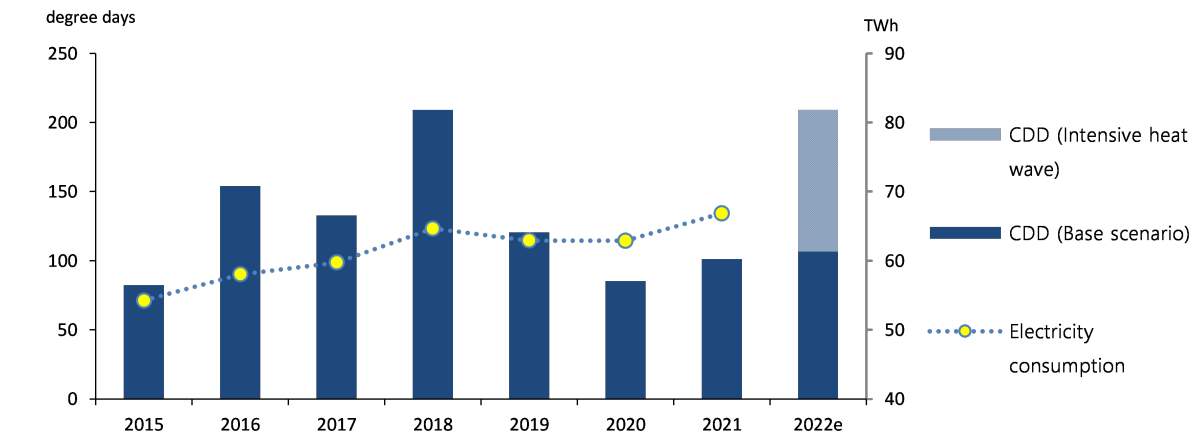
Note: The bottom of the cooling degree day bar of 2021 represents the number of possible cooling degree days assuming the average temperature of last ten years for this summer ('Base scenario') while the whole bar graph shows the value assuming that this summer will have the same number of cooling degree days as in 2018 ('Intensive heat wave scenario')
Korea Meteorological Administration("KMA") predicted a high possibility of hotter than usual summer(KMA, June 2022) for this year, and therefore, changes in electricity demand needs to be analyzed under the heat wave scenario.
If the number of cooling degree days of 2022 is the same as in 2018, the growth rate of electricity demand will be 0.6%p higher compared to the base scenario.
In the base scenario, the number of cooling degree days is expected to grow by 5.2% year-on-year in 2022, while it is expected to surge by 106.3% in the heat wave scenario, which assumed the same number of cooling degree days (209) recorded in 2018 when the weather was the hottest on record.
In the heat wave scenario, the residential electricity demand, which is affected the most by heat waves, is forecasted to increase by 5.0% year-on-year in 2022 and by 12.5% in 3Q which includes the summer season.
In the heat wave scenario, the commercial sector's electricity demand (including the public sector) is estimated to grow by 3.6% year-on-year in 2022 and by 5.5% in 3Q, which is 0.5%p and 2.0%p higher than the rates in the base scenario.
The industrial sector is expected to show the smallest change in electricity demand due to temperature change, with its annual electricity demand increasing by just 0.2%p in the heat wave scenario compared to the base scenario.
If heat waves strike in the midst of the energy supply chain crisis, it is crucial to secure power generation fuels to guarantee energy security.
If heat waves strike not only Korea but also the entire world this summer[1], the demand for power generation fuels such as coal and natural gas is highly likely to surge, which could exacerbate the current energy supply chain crisis.
In our base scenario, the total gas-fired generation is to be 36.0 TWh in 3Q. In the heat wave scenario, if the growth rate of electricity demand goes up 0.6%p, the gas-fired generation is expected to grow by 9.8% to 39.5 TWh.
Securing power generation fuels is far more significant in the energy security aspect, inspite of inflationary conditions caused by soaring fossil fuel prices.
Attachments-
단기(상)_표지.jpg
Download
-
KoreaEnergyOutlook_2022H1_FirstHalf.pdf
Download
View Details
-
Energy Demand Outlook (2021, Second Half)
- Date2022/01/10
- Author Energy Demand and Supply Research Team
- Number of downloads 22
-
Download multiple files Download the entire file
Total Primary Energy Supply and Total Final Consumption /h1>
Total Primary Energy Supply ("TPES") for the first half in 2021 posted a year-on-year increase of 3.2% driven by an overall recovery of economic activities
As the global economy enjoyed a recovery, the total export value in Korea jumped up and as a result, the production activity in the mining and manufacturing industries became activated. The production activity in the service sector also showed signs of recovery. Against this backdrop, the energy consumption grew at a fast speed of more than 3%
Growth Rate of GDP and TPES, Production Index
* Production indexes show year-on-year differences
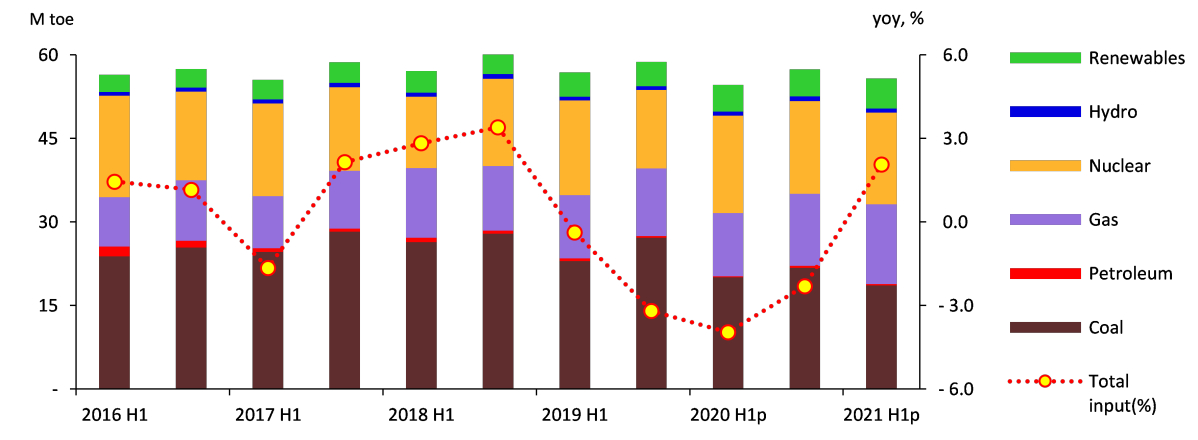
Despite of a drop in nuclear and coal use, Total Energy Consumption ("TEC") climbed up rapidly as petroleum, gas and renewable energy consumption increased
Coal use declined by 1.8% due to a fall in the power generation sector, although in the final use sector, coal consumption rose mainly for industrial use
While the growth in petroleum use in the transport sector became stagnant in a backwash of COVID-19 pandemic, the industrial use increased thanks to a business recovery and expansion of petroleum facility. Consequently, the total petroleum consumption posted a year-on-year growth of 2.6%
Growth Rate of TPES & Contribution by Source
Natural gas use rose by 13.7% year-on-year as the consumption in the power consumption went up rapidly due to increased electricity consumption and a drop in base-load generation and the amount of gas used for producing city gas showed a decent growth
Nuclear power generation declined by 5.9% as the facility capacity stayed the same and the operation rate of nuclear power plants slightly went down. On the other side, renewable & other energy use rose by 8.8% on the back of the government policies aiming for widely deploying renewable power generation facilities
Meanwhile, electricity use posted a year-on-year increase of 3.6% as the industrial sector witnessed a rapid growth in its power consumption with increased production activities. Also, the consumption in the building sector went up decently as the demand for heating jumped up due to cold snaps at the beginning of the year and the service industry enjoyed a business recovery
Generation Input and Total Generation Input Growth by Energy Source<4 >
While the energy use in the transport sector became stagnant, the total final energy consumption for the first half in 2021 increased by 4.0% with a rapid growth in the industrial and building sectors
Industrial energy use stepped up by 4.8% year-on-year as the economy recovered from the impact of COVID-19 pandemic to boost production activities in the mining and manufacturing industries, mainly driven by energy-intensive businesses
Although the road transport sector, which has the largest share in energy consumption, posted a 2.3% growth, the total energy use in the transport sector stayed almost at the same (0.6%) on the year-on-year basis with the 13.2%, 3.3% and 8.4% decreases in the air, marine and railroad transport sectors
Growth Rate of TFC & Contribution by Source<4 >
* Include residential, commercial, public·etc usage
As for the building sector, the residential, commercial and public sectors jumped up by 4.0%, 2.3% and 8.4% respectively on the year-on-year basis due to a business recovery in the service industry and cold snaps at the beginning of the year
TPES & TFC Outlook
Total Primary Energy Supply ("TPES") is expected to increase by 3.9% and 2.7% in 2021 and 2022 respectively to reach 311.3 million toe
Thanks to a base effect resulting from a decline trend for last two consecutive years and a rapid recovery in production activities, TPES is anticipated to increase by nearly 4% in 2021. Similarly, energy consumption in 2022 is likely to rise as the negative impact of COVID 19 pandemic is expected to abate
Growth Rate of GDP, TPES and TFC, Trend and Outlook
Recently, Energy Intensity (toe/million KRW) recovered fast with a decline in energy use. As this recovery acts as a base effect, Energy Intensity is expected to stay at the 2020 level from 2021 to 2022
Energy Intensity and EI Recovery Trend
Note: Energy Intensity is calculated as the value of 'TPES/GDP', expressed in toe/million. EI recovery rate multiplies EI increase rate by '-1'
While petroleum and gas will lead the increase in the energy demand in 2021, petroleum, nuclear and renewable energy sources are expected to take the lead in 2022
The demand for petroleum is likely to grow fast in 2021 in the industrial sector, especially for petroleum used as a raw material in the petrochemical industry. Similarly, in 2022, the petroleum demand is expected to rise in the transport sector mainly for road and air transportation
The demand for coal in the final consumption sector will go up at a decent rate driven by the iron making industry. However, as the demand in the power generation sector is likely to decline or become stagnant, the growth rate in the demand for coal is anticipated to stay at a 1-2% level
In 2021, nuclear power will experience a slight drop as its capacity factor declines a bit. However, nuclear generation is expected to rise by more than 5% in 2022 with one new large-capacity unit coming online
As for natural gas, the demand is likely to step up rapidly with a surge in gas consumption from the power generation sector. However, the growth in the total gas demand is forecast to slow down dramatically as the gas used for generation witnesses a slight decrease
Electricity demand fell for two years in a row since it reached the peak of 526.1 TWh in 2018. The demand for electricity, however, is expected to surpass the 2018 high in 2021 and approach a 540 TWh level in 2022
Growth Rate of TPES & Contribution by Source
Energy demand in the final consumption sector is expected to grow by 4.7% in 2021 and 2.3% in 2022
Energy demand in the industrial sector will rise by more than 6% in 2021 thanks to a recovery in production activities across industries as well as facility expansion and increased facility utilization rate of energy-intensive industries. On the same note, the industrial energy demand is anticipated to increase by more than 2% on the back of a decent economic growth rate of 3% in 2022
Change and Growth Rate of TFC by Energy Sources & End-use Sector, 2021 and 2022
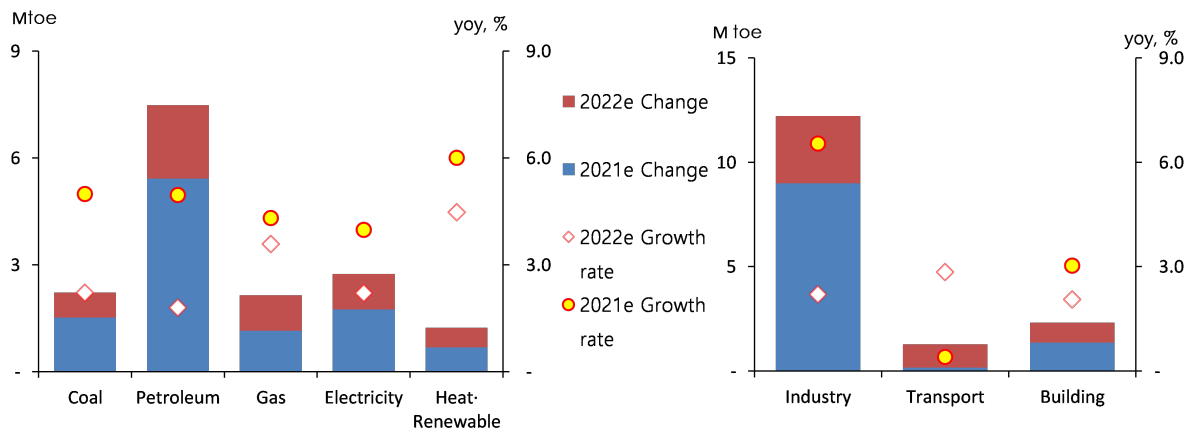
In the transport sector, the energy demand continues to be stagnant in 2021 due to the impact of COVID-19 pandemic. However, it is expected to recover fast mainly in the second half of 2022 as the energy demand in road and air transport sectors starts to improve
Energy demand in the building sector is anticipated to keep rising at a 2-3% level driven by several factors including a base effect and a temperature effect
Key Features and Implications
Surge in Global Energy Prices
As natural gas prices are taking sudden changes, the uncertainty of outlook for gas and the role of nuclear power are expected to grow
Due to a mix-up between the supply and demand of natural gas in the global market, LNG price almost trebled compared to the price in June. However, a possibility of an LNG price collapse is emerging as well, giving a boost to uncertainties around gas prices
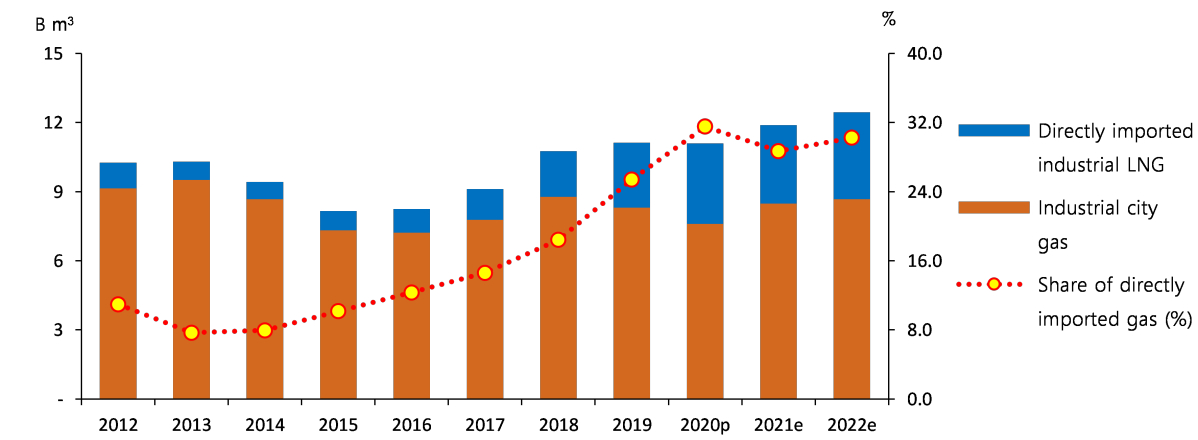
In 2022, natural gas price is expected to be higher than average. Consequently, the pressure to increase the domestic city gas price is likely to increase while the growth in direct LNG imports, which have surged over the last few years, will significantly slow down
Trend and Outlook of Industrial City Gas & Directly Imported Industrial LNG
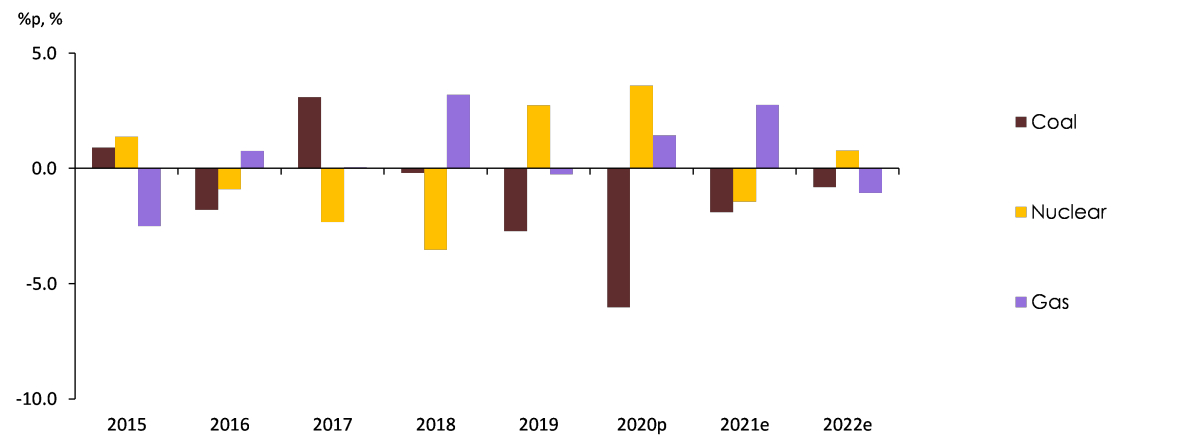
Influenced by increased price of natural gas, the share of gas in the generation mix in 2022 will decline. On the other side, the proportion of nuclear power is likely to grow as it is to step in for the reduction of gas-fired generation
Share in Generation Input Mix by Energy Source
The surge in oil price, triggered by the imbalance between supply and demand of global crude oil, is expected to be short-lived and limited in influencing the domestic market
The oil demand jumped up thanks to the global economic recovery from the impact of COVID-19 pandemic. However, the production increase from oil-producing countries did not keep up with the recovery, which strongly drove up the global oil price. Nevertheless, the monthly average of Middle East Dubai crude oil kept being sluggish after it hit $82.2/barrel in August
Petroleum products in the domestic market also witnessed large price jumps. Since last November, the retail prices of all petroleum products soared
As the global crude oil price goes up, the prices of petroleum products in the domestic market are anticipated to rise for the time being. However, the impact of increased global oil price on the supply and demand of petroleum in the transport and industrial sectors is likely to be limited
Increased Uncertainty Amidst Spread of COVID-19 Virus
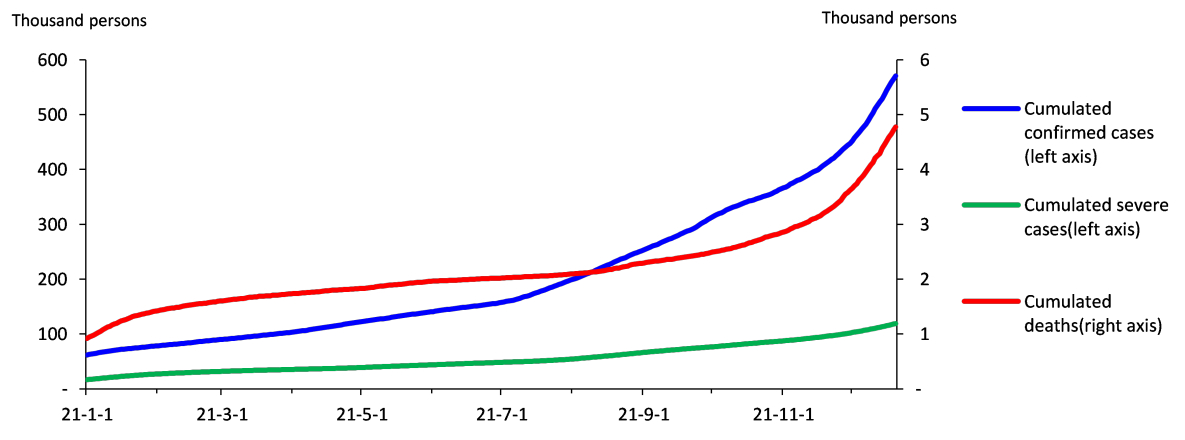
The uncertainties related to COVID-19 pandemic rise as the number of confirmed cases soared after November 1 and a new variant of Coronavirus has surfaced
Korea had adhered to enhanced Social Distancing restrictions, including a cap of five people per social gathering. However, the Moon administration decided to switch to Gradual Return to Normal phase on the back of more than 80% of First Dose vaccination rate and over 75% of Second Dose vaccination rate
Unfortunately, since November 1 commencing Phase 1 of Gradual Return to Normal, the number of confirmed cases began rising rapidly
The spread of Omicron, first detected in South Africa, marched rapidly onto all corners of the world, and the variant is becoming the dominant variant over Delta variant in some major countries. In this situation, the waves of Coronavirus can gain speed once again
Cumulated Confirmed Cases, Severe Cases & Deaths of COVID-19
In case that COVID-19 pandemic stays longer than expected, the recovery of energy demand is likely to slow down driven by the transport sector
This paper is based on the assumption that COVID-19 pandemic takes a turn for the better during 2022 and as a result, an increase in energy demand in many sectors such as transport becomes palpable in the second half
Growth in Total Final Consumption and Total Energy Demand by Scenario
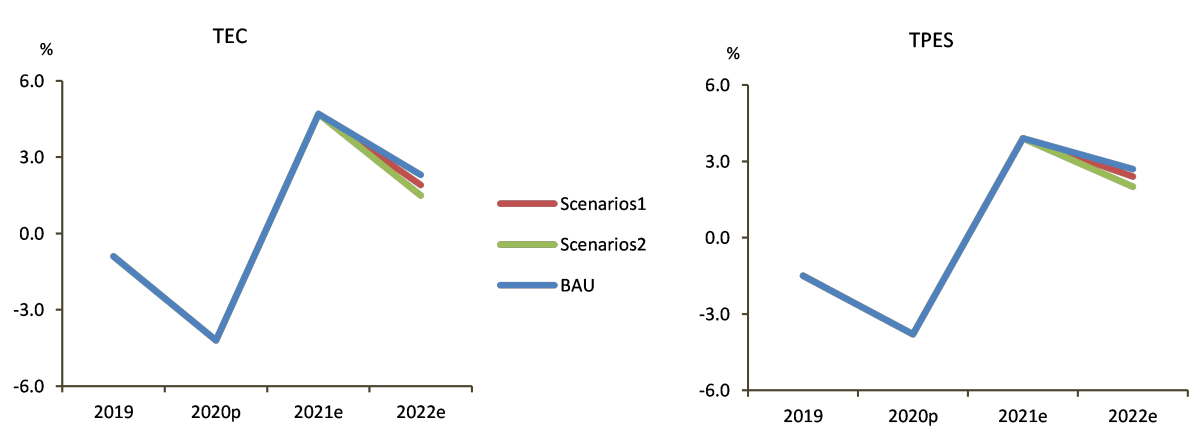
Note: Scenario 1 and Scenario 2 assumes that the negative effects of COVID-19 pandemic do not fade out in 2022. The energy demand in the air transport sector is presumed to stay at last year's level. Using Scenario 1 as a starting line, Scenario 2 employs a much more serious situation, in which the growth in the energy demand of road transport and building sectors declined by 1%p compared to BAU
However, the spread of Coronavirus gains speed recently and a new variant Omicron, more contagious than its predecessors, has surfaced. If the spread of COVID-19 continues and the wave of highly-contagious Omicron diffuses on a national scale, it is difficult to say that New Normal can be achieved over COVID-19 pandemic even in the second half of 2022 and if this is the case, the recovery of energy demand will become much slower
Attachments-
T_단기(하)_표지.jpg
Download
-
KoreaEnergyOutlook_2021H2.pdf
Download
View Details
-
Energy Demand Outlook (2021, First Half)
- Date2021/05/26
- Author Energy Demand and Supply Research Team
- Number of downloads 16
-
Download multiple files Download the entire file
Total Primary Energy Supply and Total Final Consumption /h1>
Total energy consumption reduced by 4.0% on a year-on-year basis to record 290.8 Mtoe in 2020
Total energy consumption reduced for two consecutive years as production activities in the industrial and service sectors contracted by COVID-19 pandemic and the traffic in the transport sector shrank due to Social Distancing restrictions
The growth rates of GDP and TPES, production index
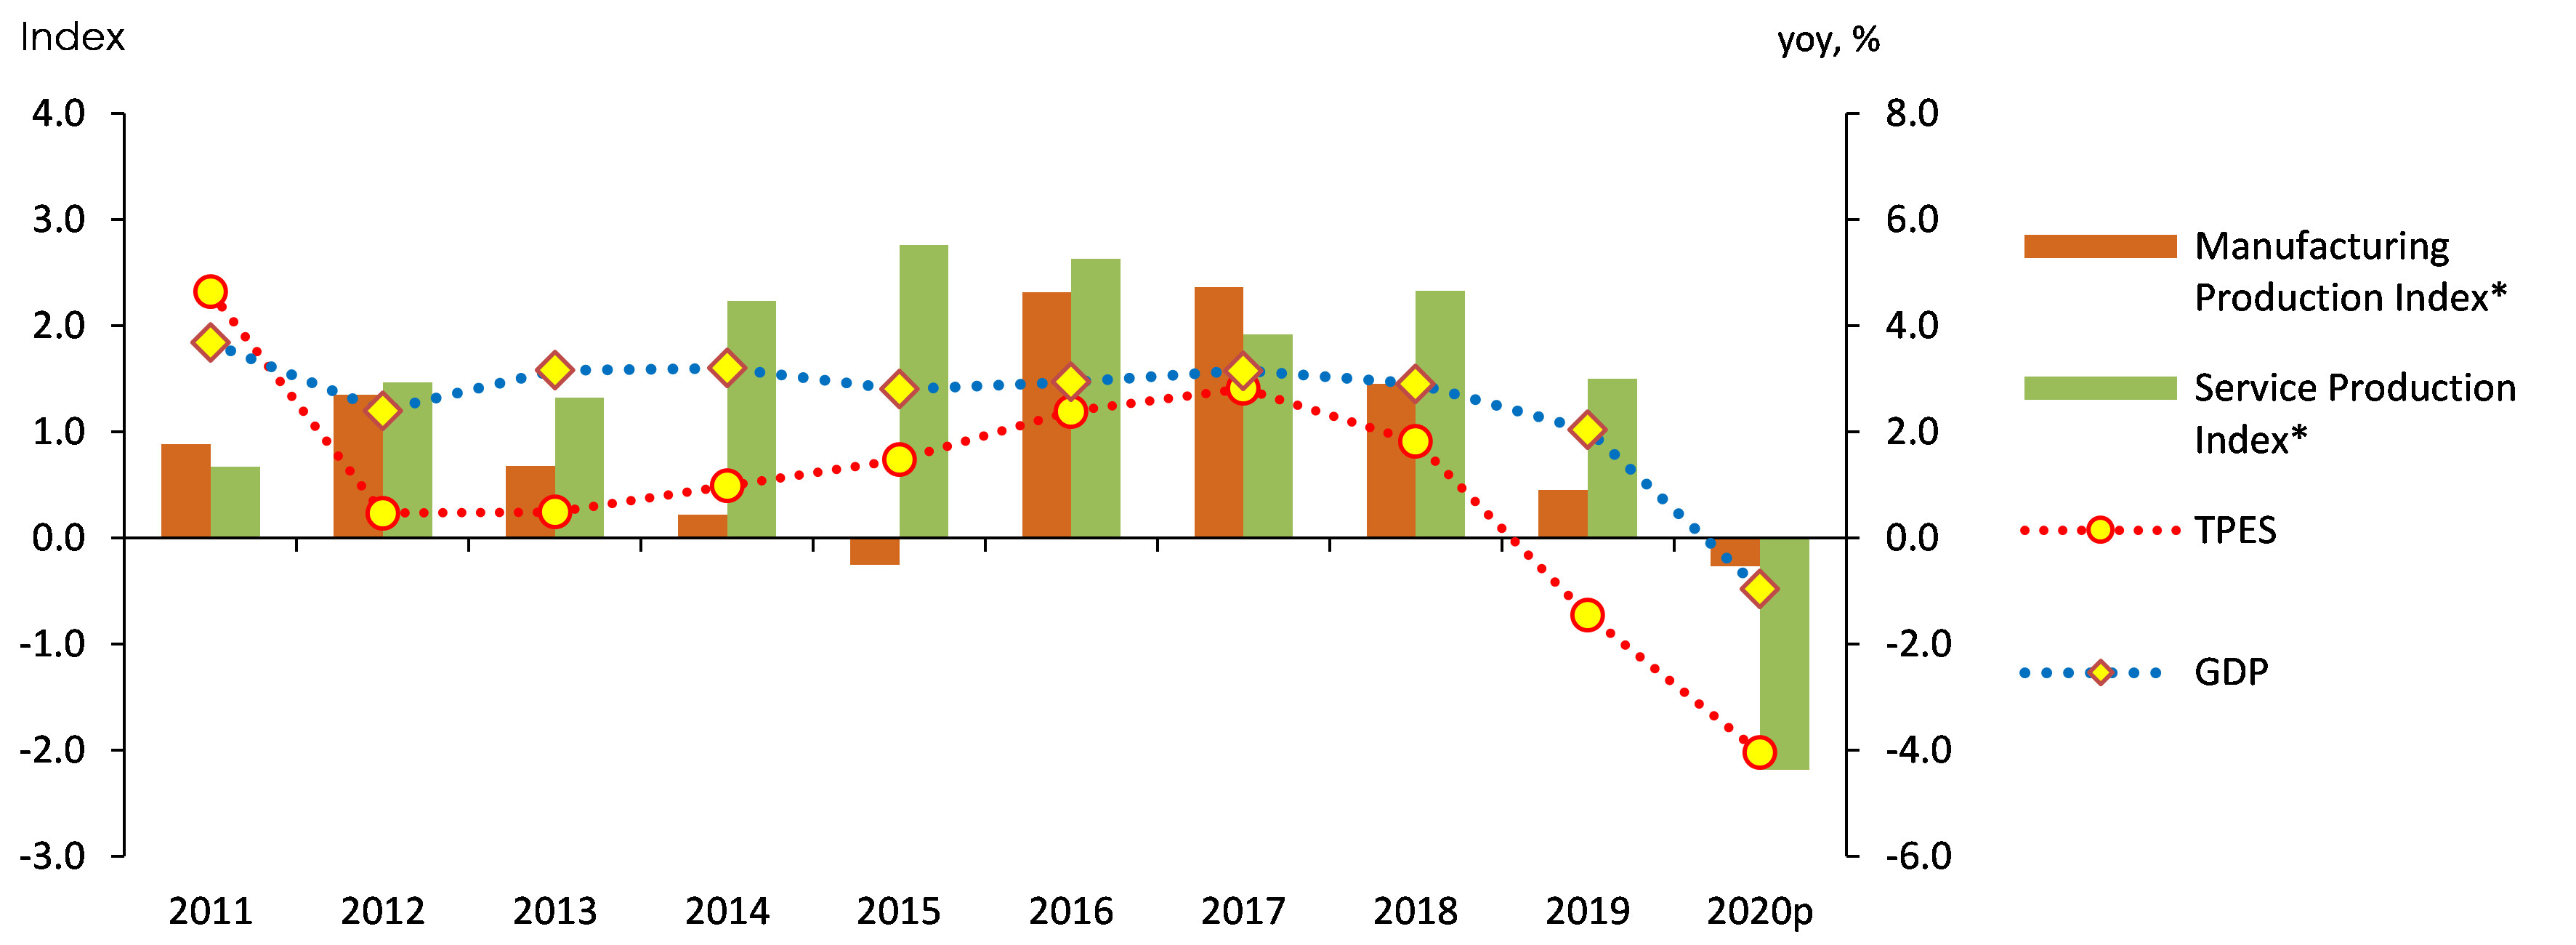
* Production indexes show year-on-year differences
Despite of increased consumption in nuclear, gas and renewables, a dramatic plunge in coal and petroleum consumption led to a decline in total energy consumption
Coal consumption showed a steep decrease in all sectors including power generation, industry and buildings, recording a year-on-year decrease of 12.4%
Petroleum consumption dropped by 5.8% year-on-year mainly in transport and industrial sectors; the former experienced a significant plunge from decreased travel demand amid COVID-19 pandemic while the latter was affected by a huge decline in petrochemical feedstock naphtha consumption
The growth rate of TPES & contributions by sources
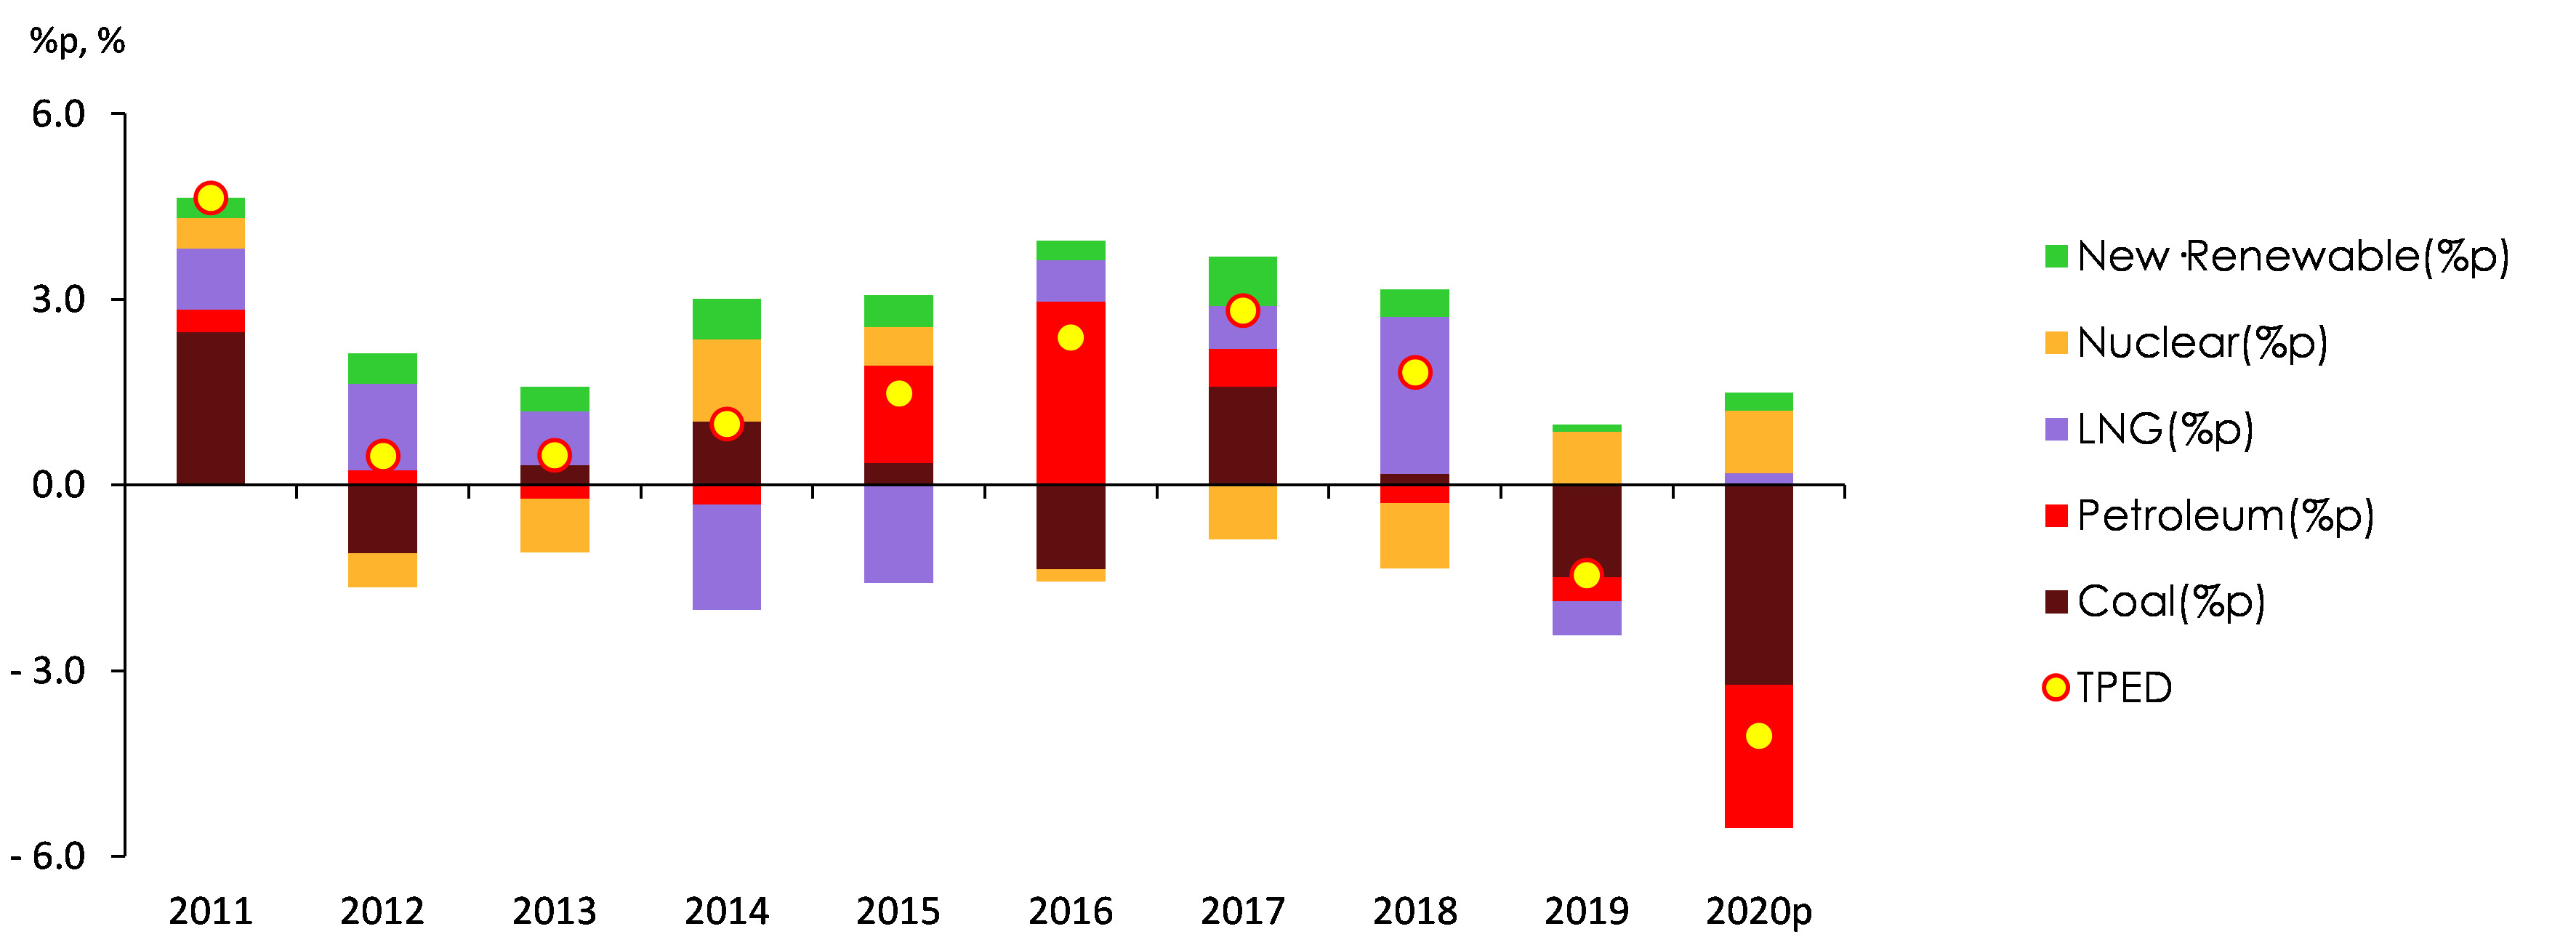
Natural gas consumption increased by 1.1% year-on-year, led by a decent increase for power generation as well as a fast growth in industrial direct imports despite the effects of decreased consumption for district heating and city gas production
Nuclear generation grew by 9.8% year-on-year, with new large-capacity generators coming on line in the second half last year and increased facility utilization rate. Similarly, renewables and other energy consumption posted a 4.0% increase thanks to the government policy for supplying renewable power generation capacity
Meanwhile, electricity consumption declined by 2.2% year-on-year mainly in the industrial sector as exports and domestic demand witnessed a rapid decrease amidst COVID-19 pandemic and overall activities became sluggish in the manufacturing sector
The growth rate of TFC & contributions by sources<4 >
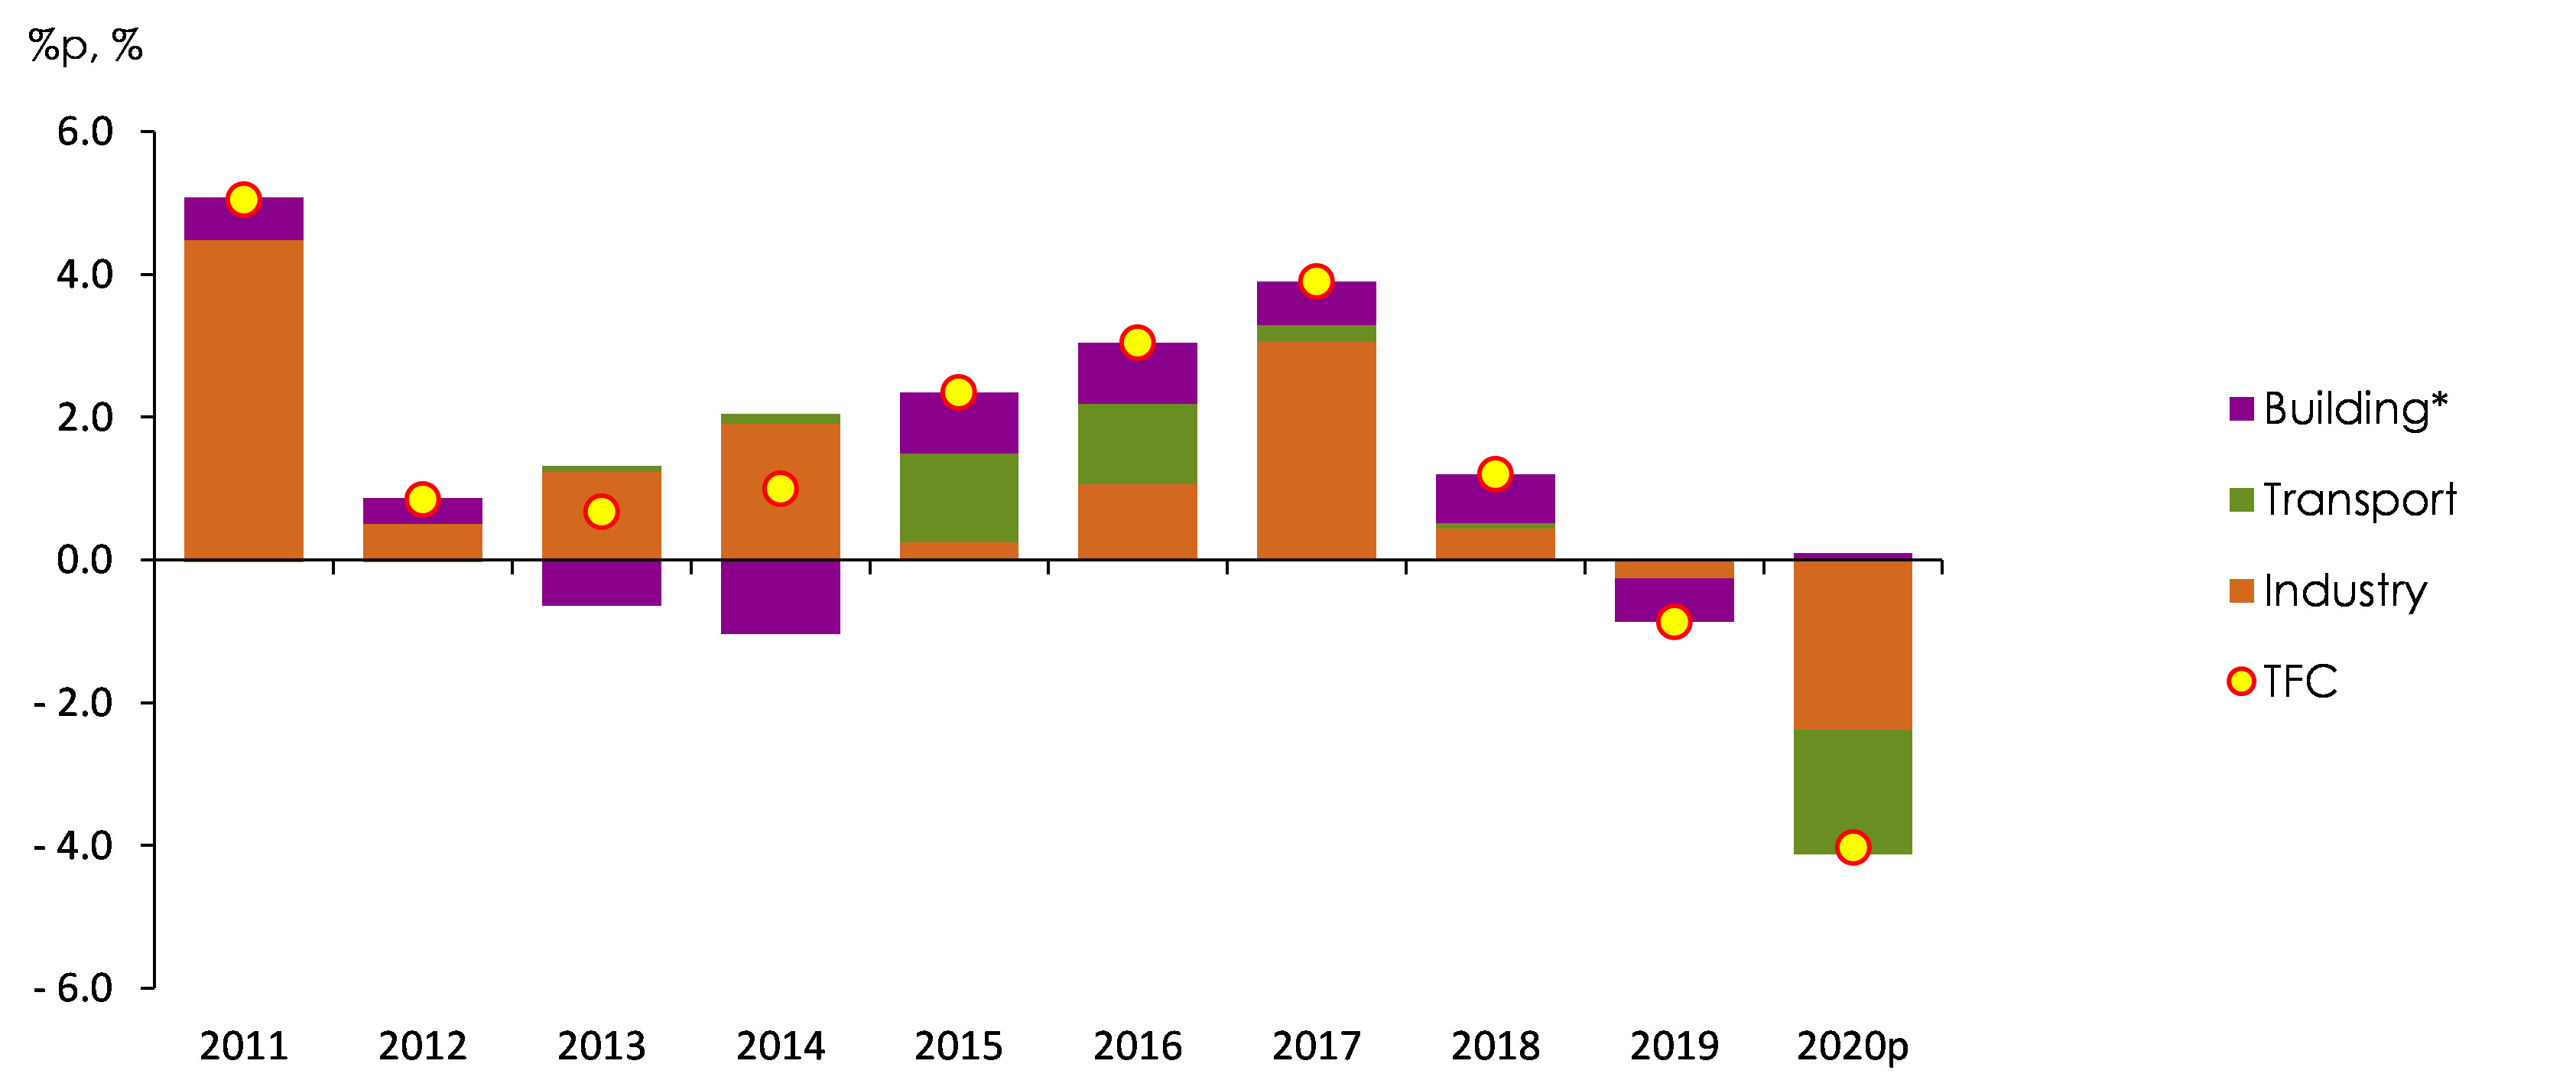
* include residential, commercial, public?etc usage
Despite the decrease in the building sector, which stayed at the same level as last year, Total Final Consumption in 2020 reduced by 4.0% as energy consumption in industrial and transport sectors declined
Industrial energy consumption went down by 3.8% year-on-year as production activities in some of the major stagnated, energy-intensive sectors were in the doldrums amid global economic slump due to COVID-19 pandemic
The change of transport petroleum use by sub-sectors<4 >
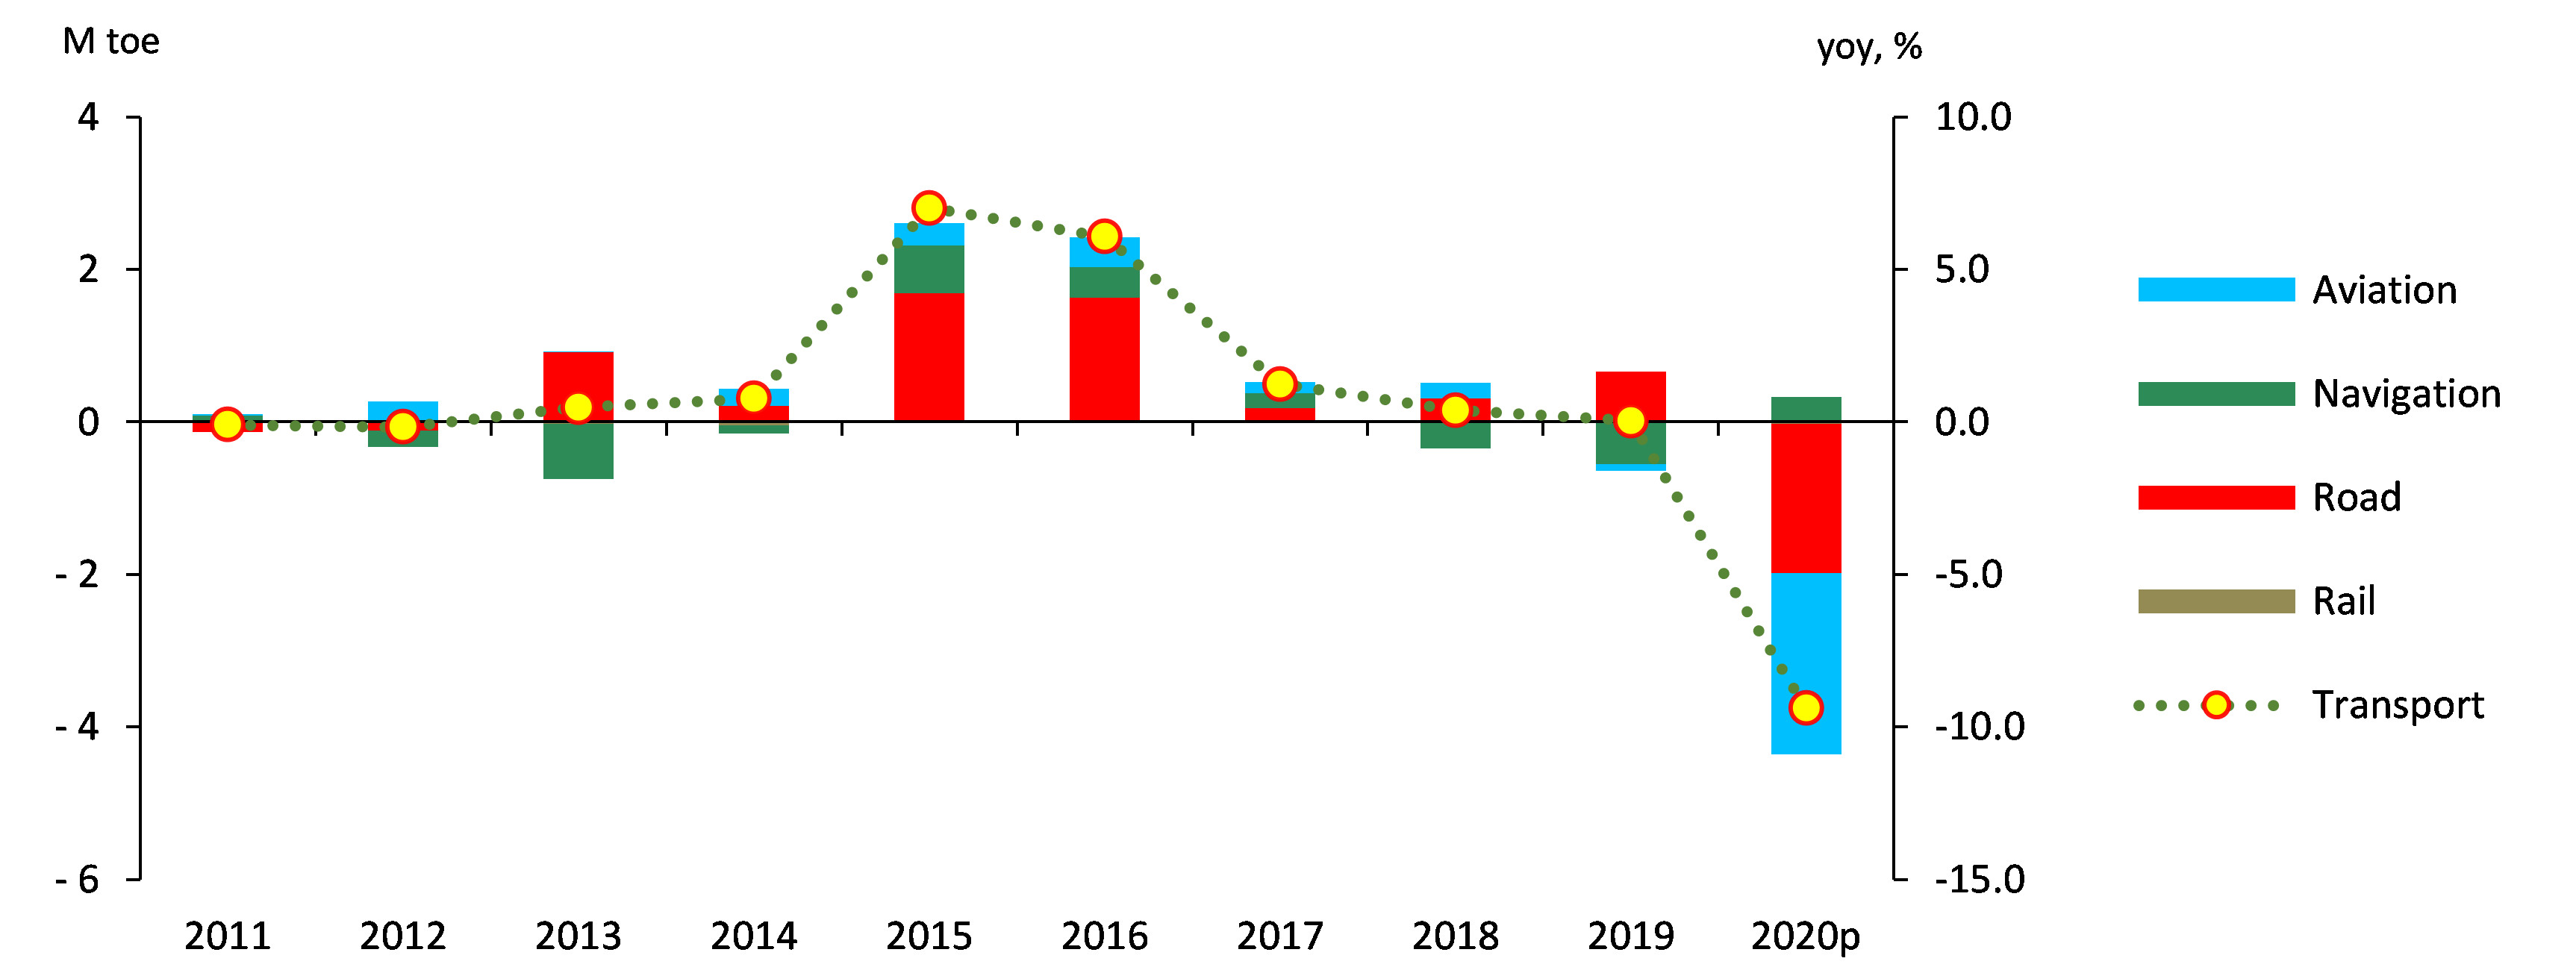
* Each subsector graph shows yoy differences
As for the transport sector, the energy consumption increased from the base effect in the marine transportation. However, the energy consumption in the road and air transportation sectors showed a steep decline due to Social Distancing restrictions enforced as a COVID-19 protective measure and a dramatic fall in demand for international travel
The effects of COVID-19 pandemic were offset as they went two opposite directions in the residential and commercial building sectors while heating degree days increased during cold winter at the end of the year, leading to a 0.5% increase in energy consumption in the building sector
TPES & TFC Outlook
Total Primary Energy Supply(TPES), which decreased for two consecutive years from 2019 to 2020, is expected to turn around to record a 4.2 increase in 2021
TPES declined from the negative effects of COVID-19 in 2020, following the decrease in 2019 resulting from the sluggish trend in industrial activities and temperature effects. As a result, TPES showed a declining trend for two successive years for the first time since Energy Balance report started
In 2021, however, Total energy demand is expected to rebound fast, as the base effect from two consecutive years of declines in TPES will come into play and the economy and society will slowly recover from the impact of COVID-19 pandemic thanks to increased vaccination rate
The growth rates of GDP, TPES and TFC, trend and outlook
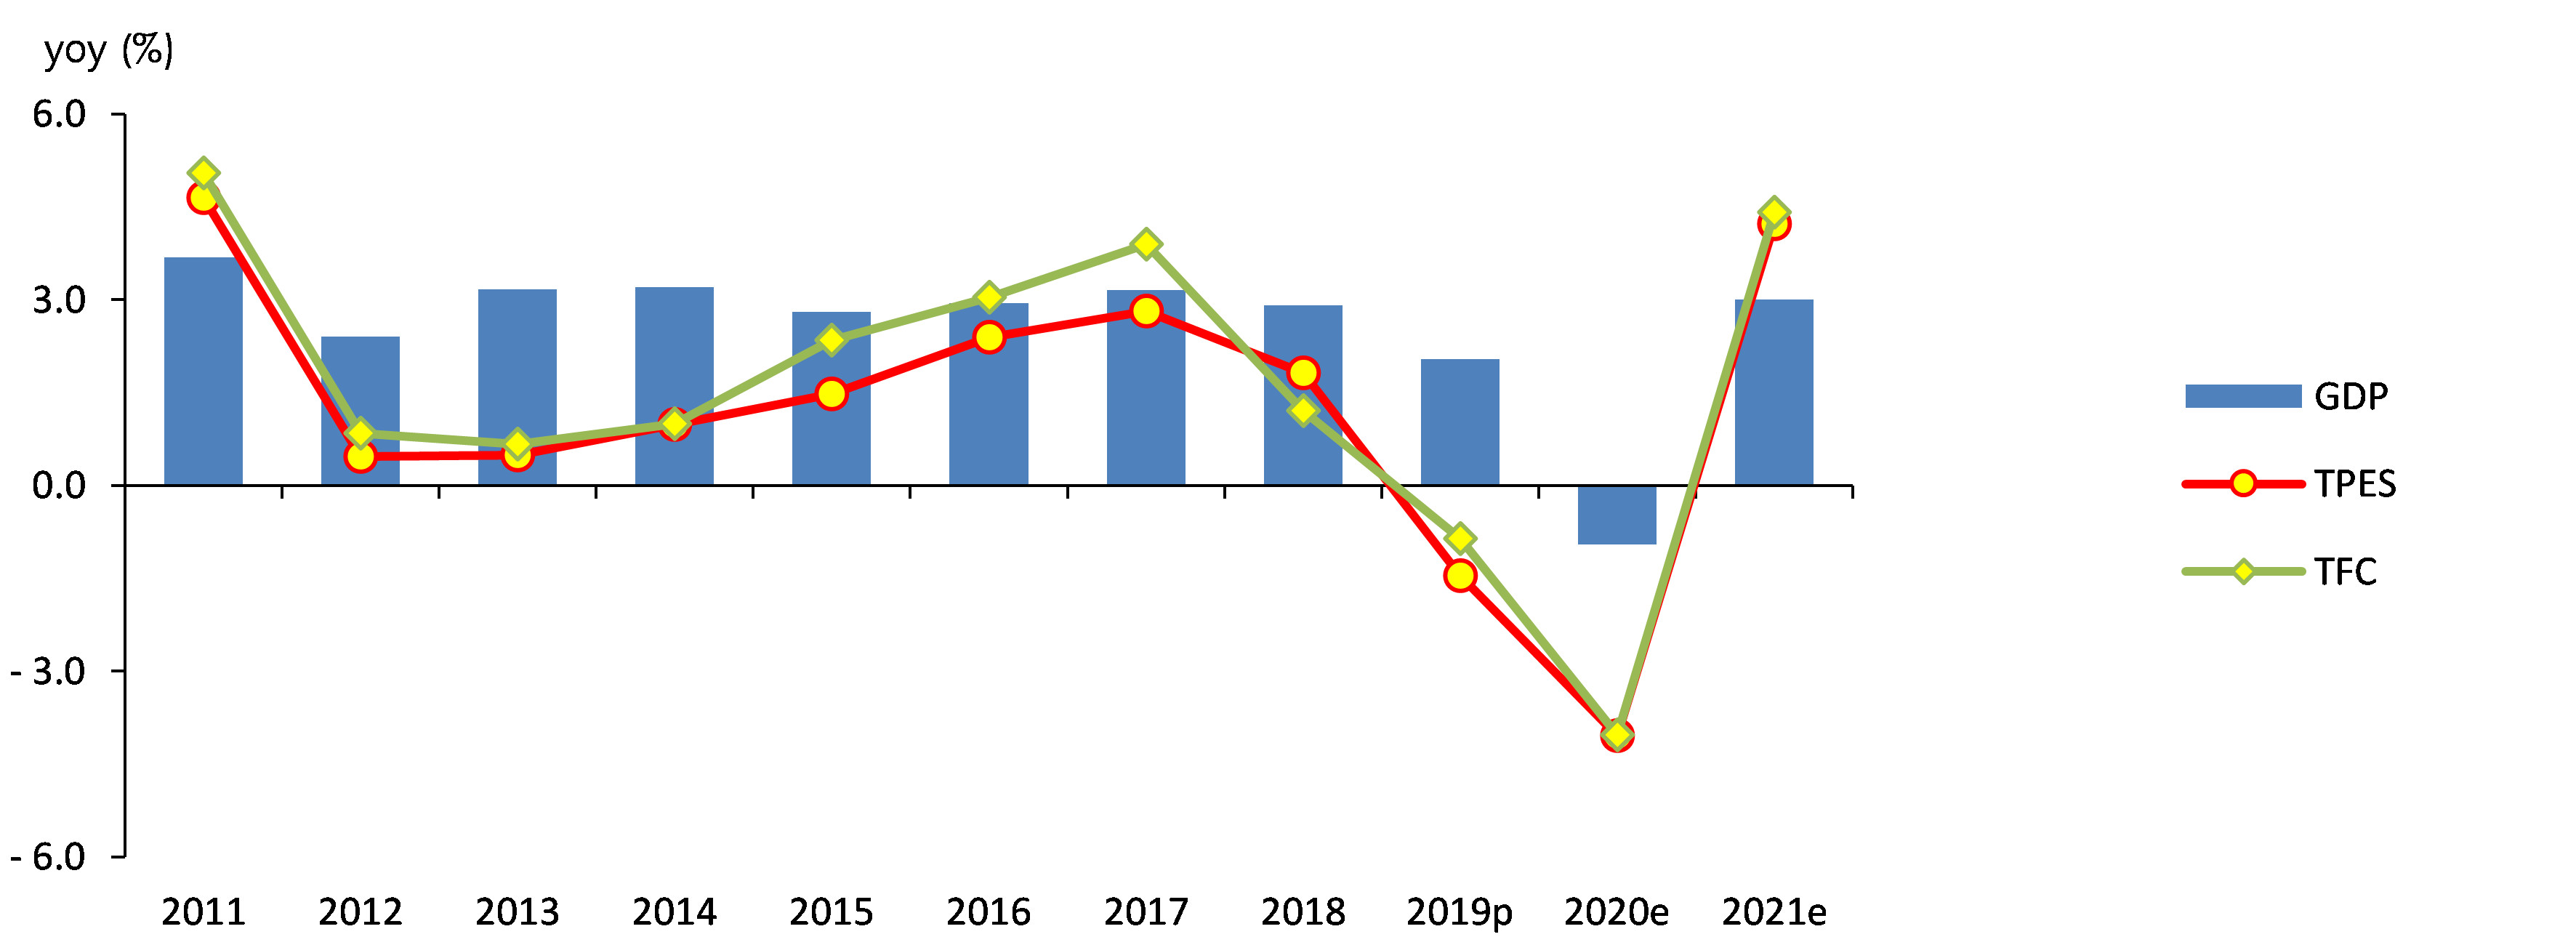
Energy Intensity (toe/KRW 1million), which recovered fast in recent months with a decrease in energy consumption, is expected to slightly decrease in 2021 driven by the base effects
Energy Intensity and EI Recovery Trends
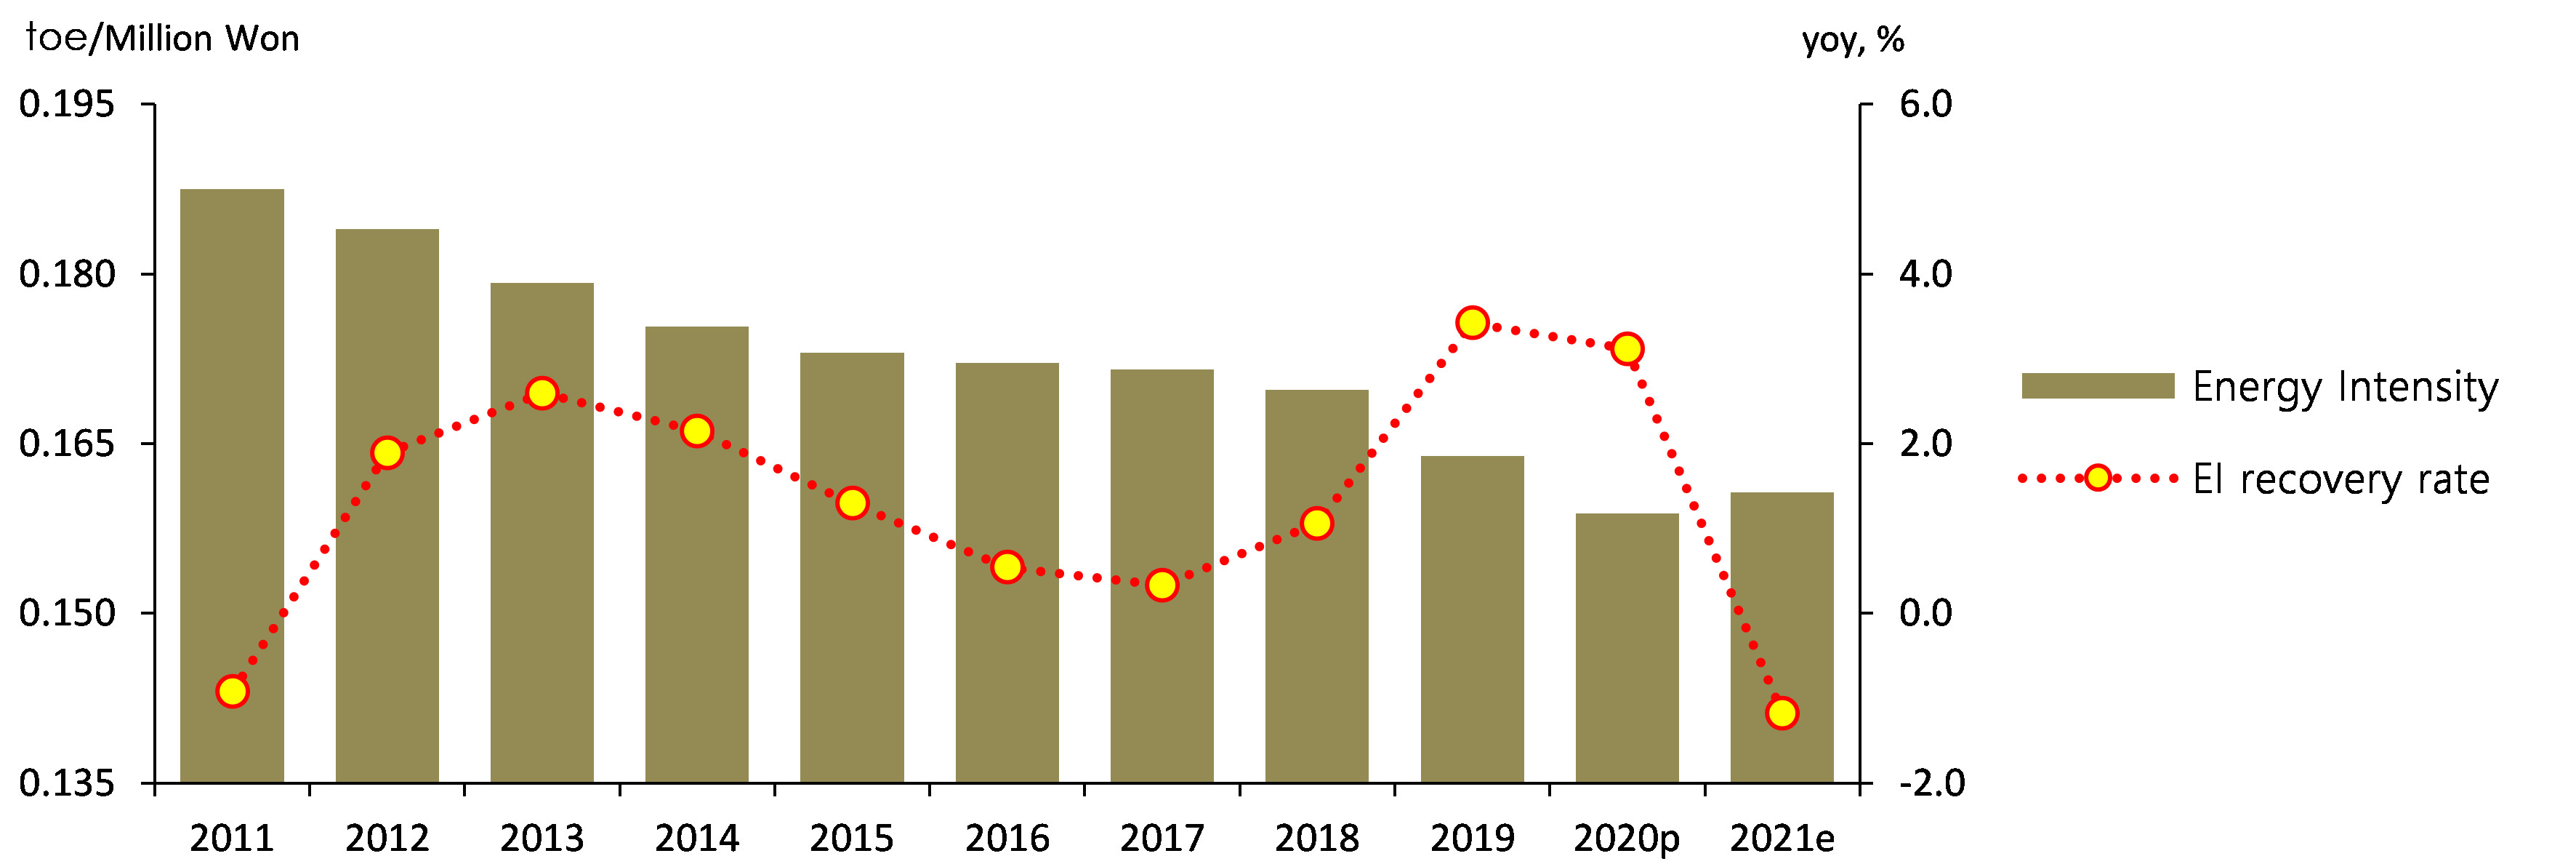
Note: Energy Intensity is calculated as the value of ‘TPES/GDP’, expressed in toe/million. EI recovery rate multiplies EI increase rate by ‘-1’
Demand for all energy sources except coal is expected to grow
Petroleum demand is anticipated to increase by 6% year-on-year as the demand for naphtha and LPG used as base material skyrocketed in the industrial sector and the transport sector also showed a decent increase in petroleum demand with signs of recovery for travel demand thanks to an increased number of vaccinated people
Coal demand is expected to decrease by 0.5% year-on-year on the back of decreased consumption for power generation although final consumption of coal rebounded in the iron making sector
Nuclear generation is forecasted to grow by 7% as capacity utilization factor increased and facility capacity rose with new generators coming to online
Overall, natural gas demand is expected to rise by middle of 4% range on a year-on-year basis with a consistent upward trend in demand for power generation. The demand for city gas manufacturing rebounded, also contributing to the growing trend
Electricity demand is expected to rise by more than 3% year-on year, driven by temperature effects and the impact of COVID-19 pandemic starting to subdue
The growth rate of TPES & contributions by sources
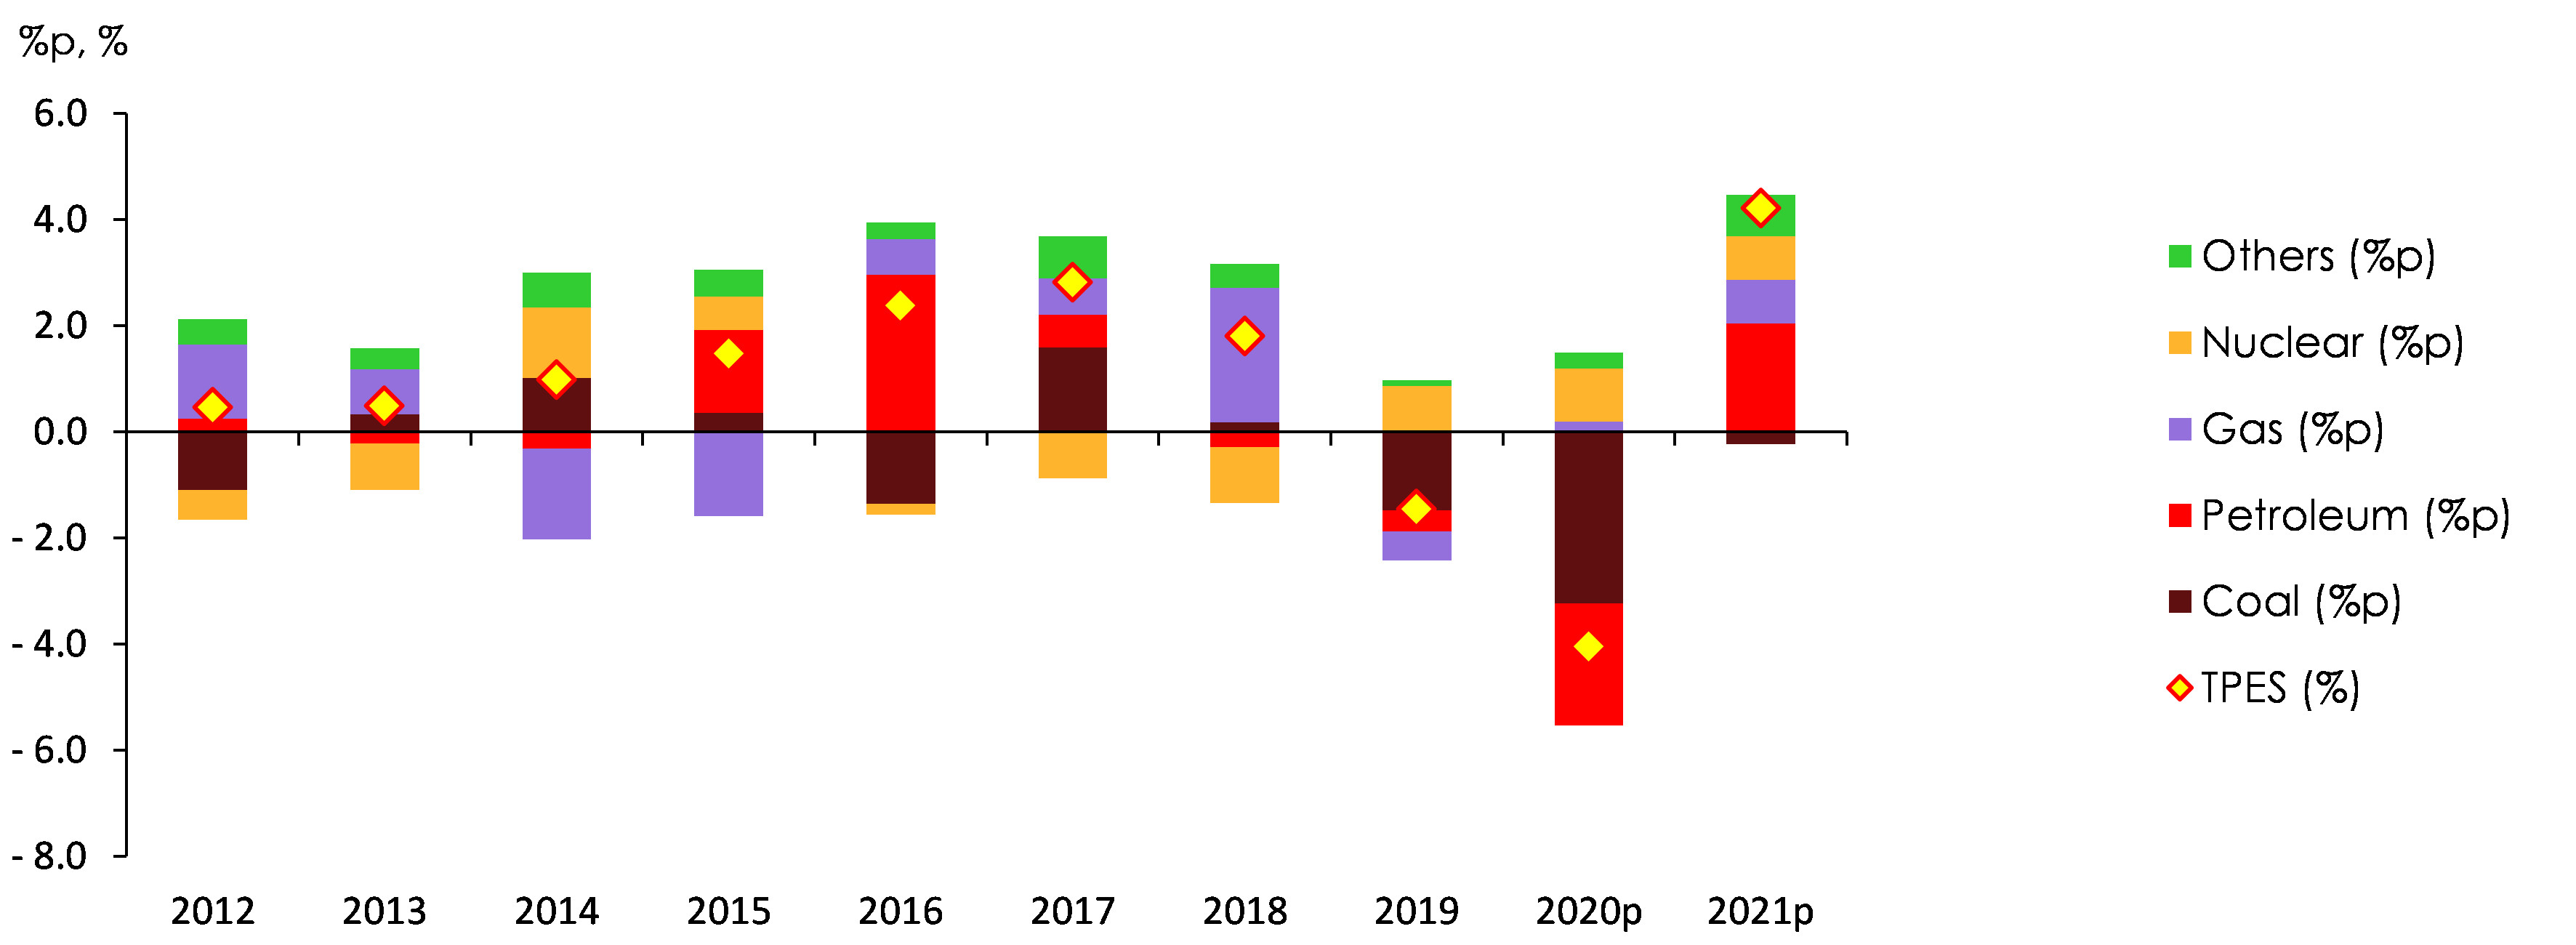
Final energy demand is forecasted to grow by 4.4 in all sectors
Energy demand in the industrial sector is expected to increase by 5% year-on-year as the economy, sluggish over COVID-19 pandemic, started to recover. Capacity expansion and increased capacity utilization in energy-intensive industries such as iron making and petrochemical also played a role in energy demand growth
The change and growth rate of TFC by energy sources and end-use sectors, 2020 and 2021
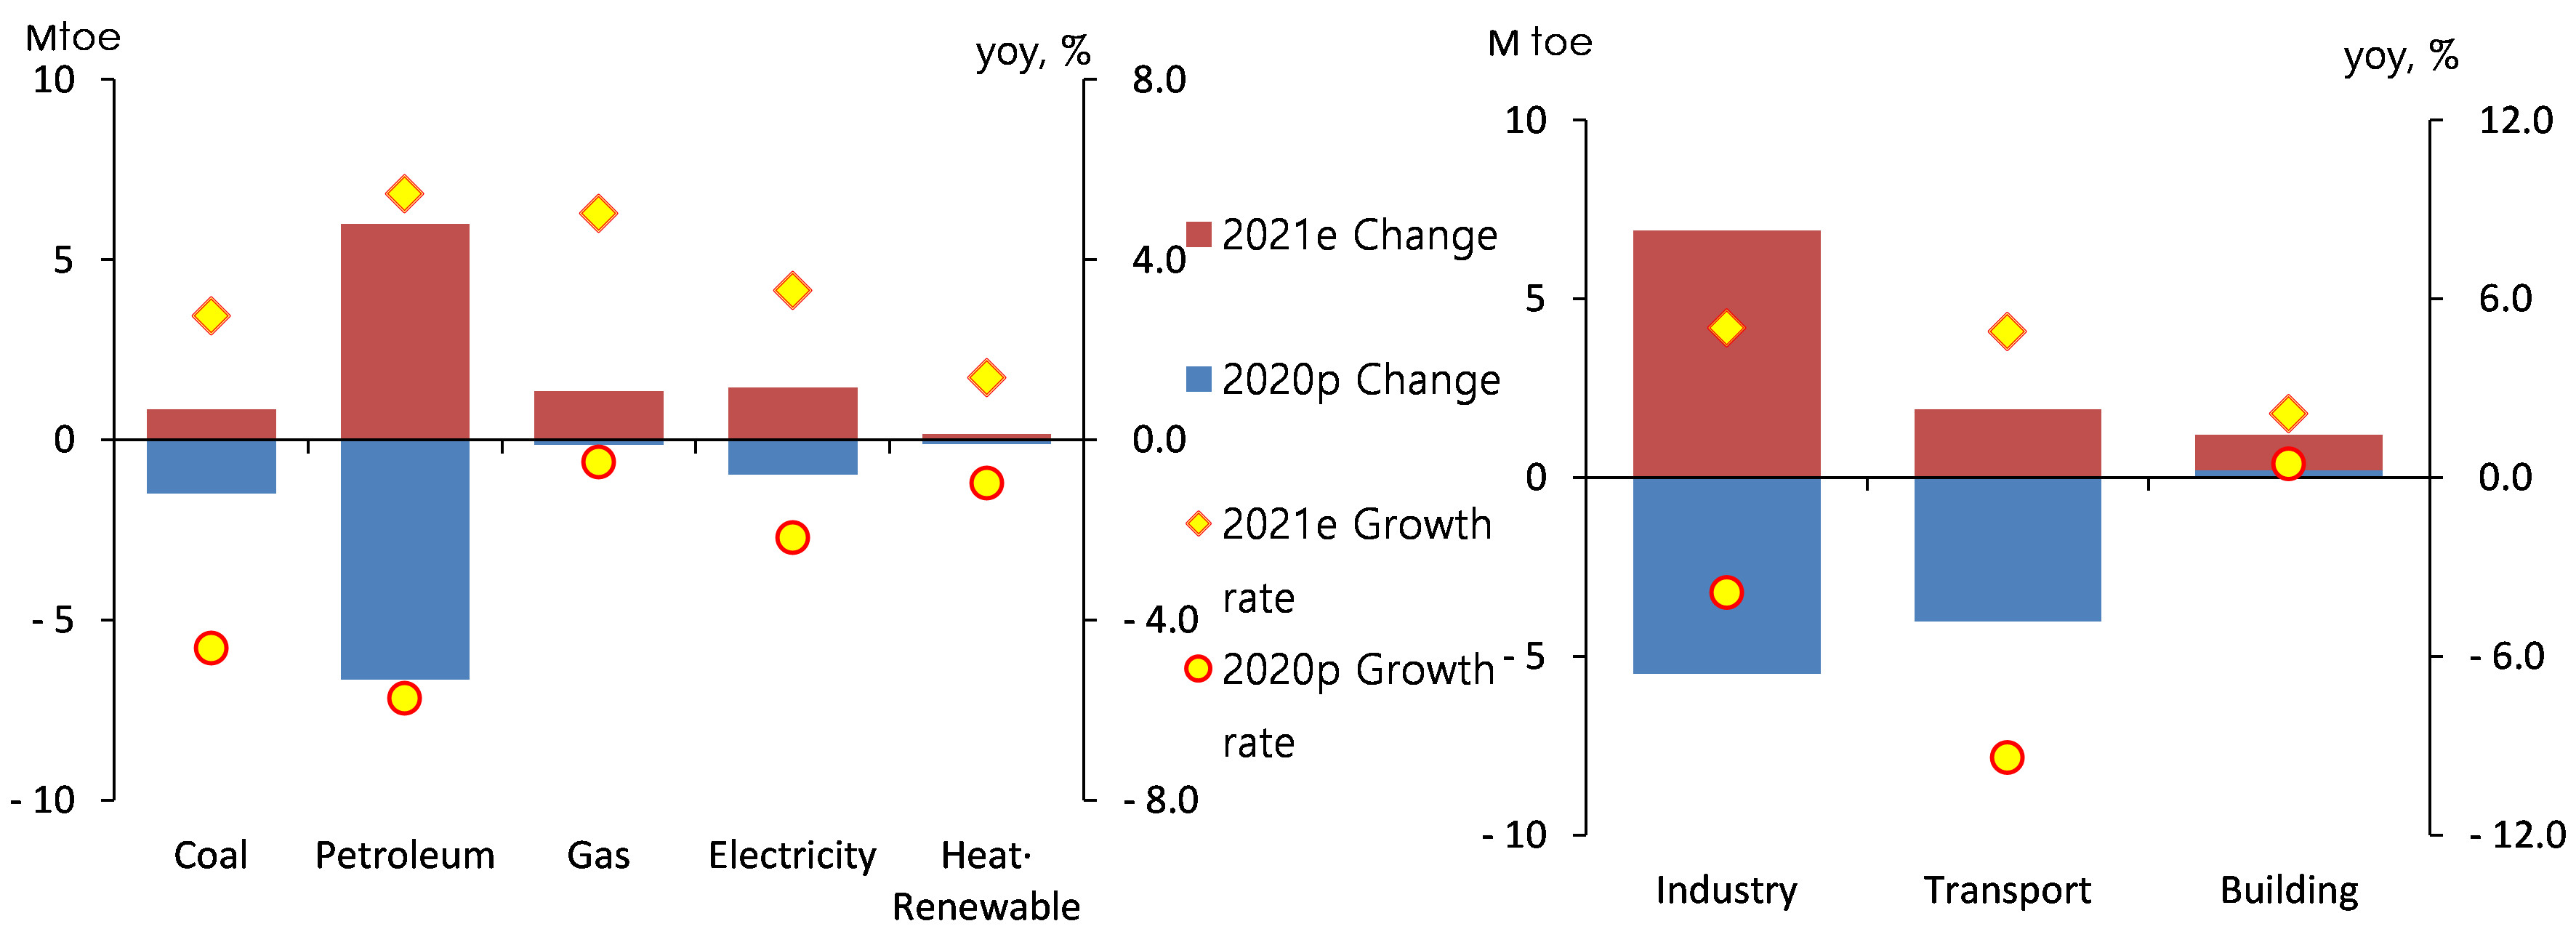
With travel demand recovering mainly in the second half of the year, energy demand in the transport sector is anticipated to grow by 5% driven by the base effect from previous year’s plunge of -9.4%
Energy demand in the building sector is expected to rise by 2% year-on-year on the back of the temperature effect, resulted from the cold events in the beginning of the year and more cooling degree days, as well as a growth in energy consumption in the commercial sector thanks to the mitigated impact of COVID-19 pandemic
Key Features and Implications
COVID-19 and Energy Demand
Due to COVID-19 pandemic and Social Distancing restrictions, the growth in TPES showed a faster YoY decline than GDP growth in 2020
In the face of serious COVID-19 crisis, GDP recorded a mere 1.0% decrease while Total Energy Consumption declined by 4.0% year-on-year as energy consumption in energy-intensive sectors and the service sector as well as the transport sector with the dramatic fall in travel demand
The commercial sector decreased especially in the ‘face-to-face’ sector negatively impacted by Social Distancing restrictions while energy consumption in the residential sector slightly increased with more work time from home
Recently, as more and more people feel fatigue about COVID-19 pandemic, they have become less sensitive to the spread of COVID-19
Considering the movement of population during the pandemic and the ratio of ‘confirmed cases VS population movement,’ less people are willing to comply with Social Distancing measures with increased sense of fatigue from extended COVID-19 pandemic
Population movement during COVID-19 pandemic phases
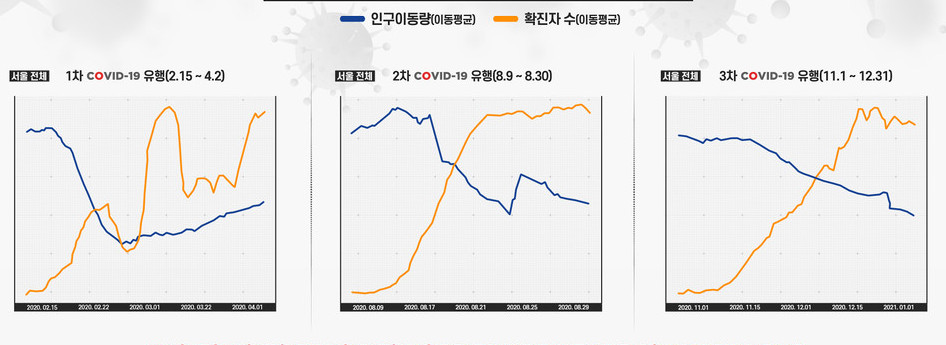
Source: http://it.chosun.com/site.data.html dir/2021/02/06/2021020600333.html (2021.2.7)
Average weekly newly-confirmed cases (Left) and average population movement (Right)
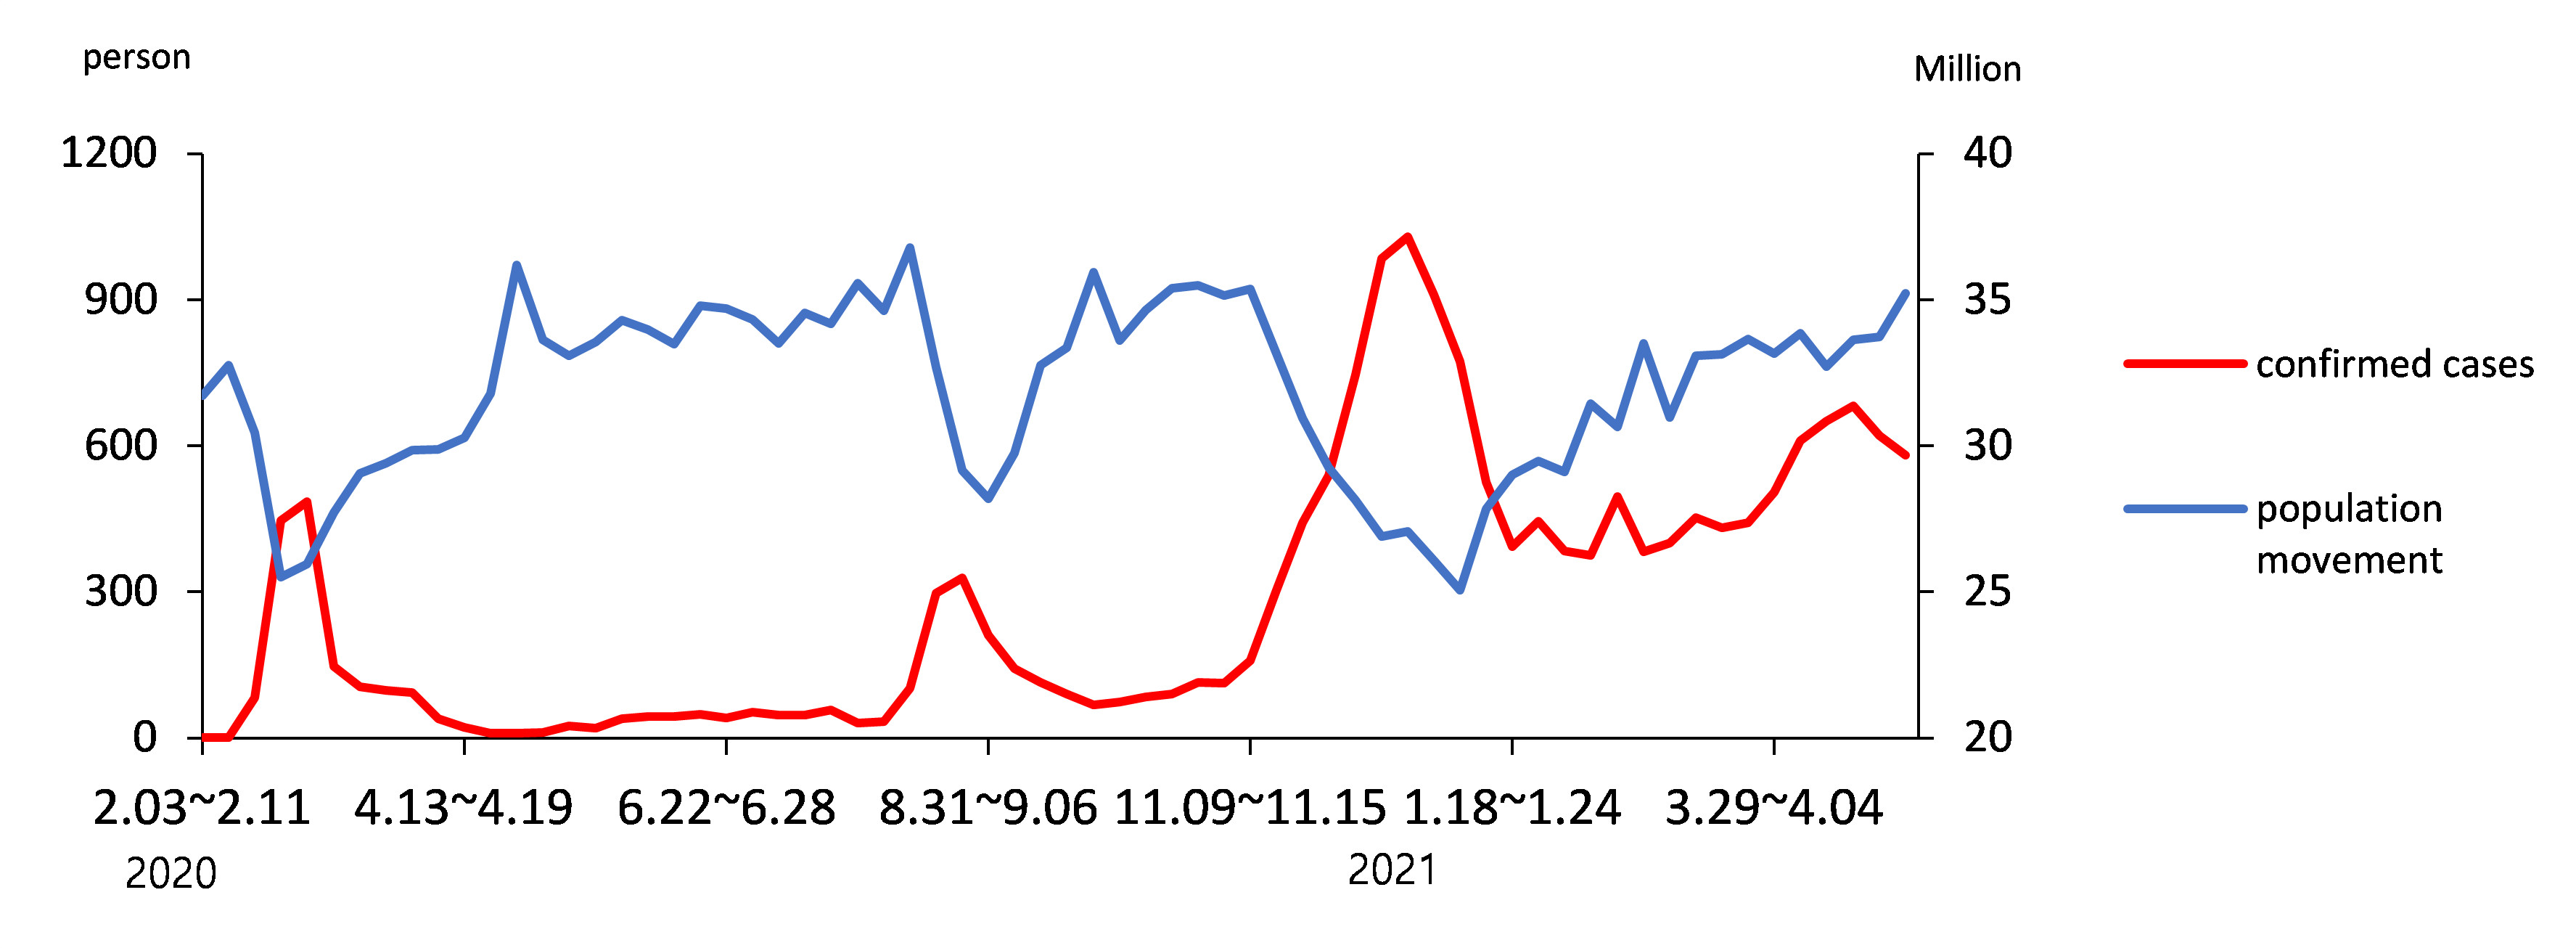
Source: KOSIS (2021.5.4)
In 2021, energy consumption is expected to rise mainly in industrial and transport sectors with weaker impact of COVID-19 pandemic
Recently, exports increased in energy-intensive sectors such as semiconductor, petrochemical and automobile industries, leading to recovery of industrial production activities. As a result, energy consumption in these sectors is likely to increase
As for the transport sector, overall consumption is expected to grow with base effects and less people complying with Social Distancing measures. However, the recovery of energy consumption in the air transport sector seems some way off as global recovery stayed sluggish due to new strands of COVID-19 being discovered in India and other countries
Energy consumption in the commercial and public building sector is likely to switch from the downfall to an upward trend as more and more people become insensitive to COVID-19 pandemic. As long as there is no abrupt rise in the number of newly-confirmed cases, the pattern of increase in energy consumption in residential buildings is expected to gradually slow down
Energy consumption in the transport sector, affected the most by COVID-19 pandemic, reduced by 9.4% year-on-year in 2020
COVID-19 preventive measures significantly cut down travel demand, causing energy consumption in road and air transport sectors to free-fall
Change in volume and rate of petroleum product consumption in transport sector (YoY)
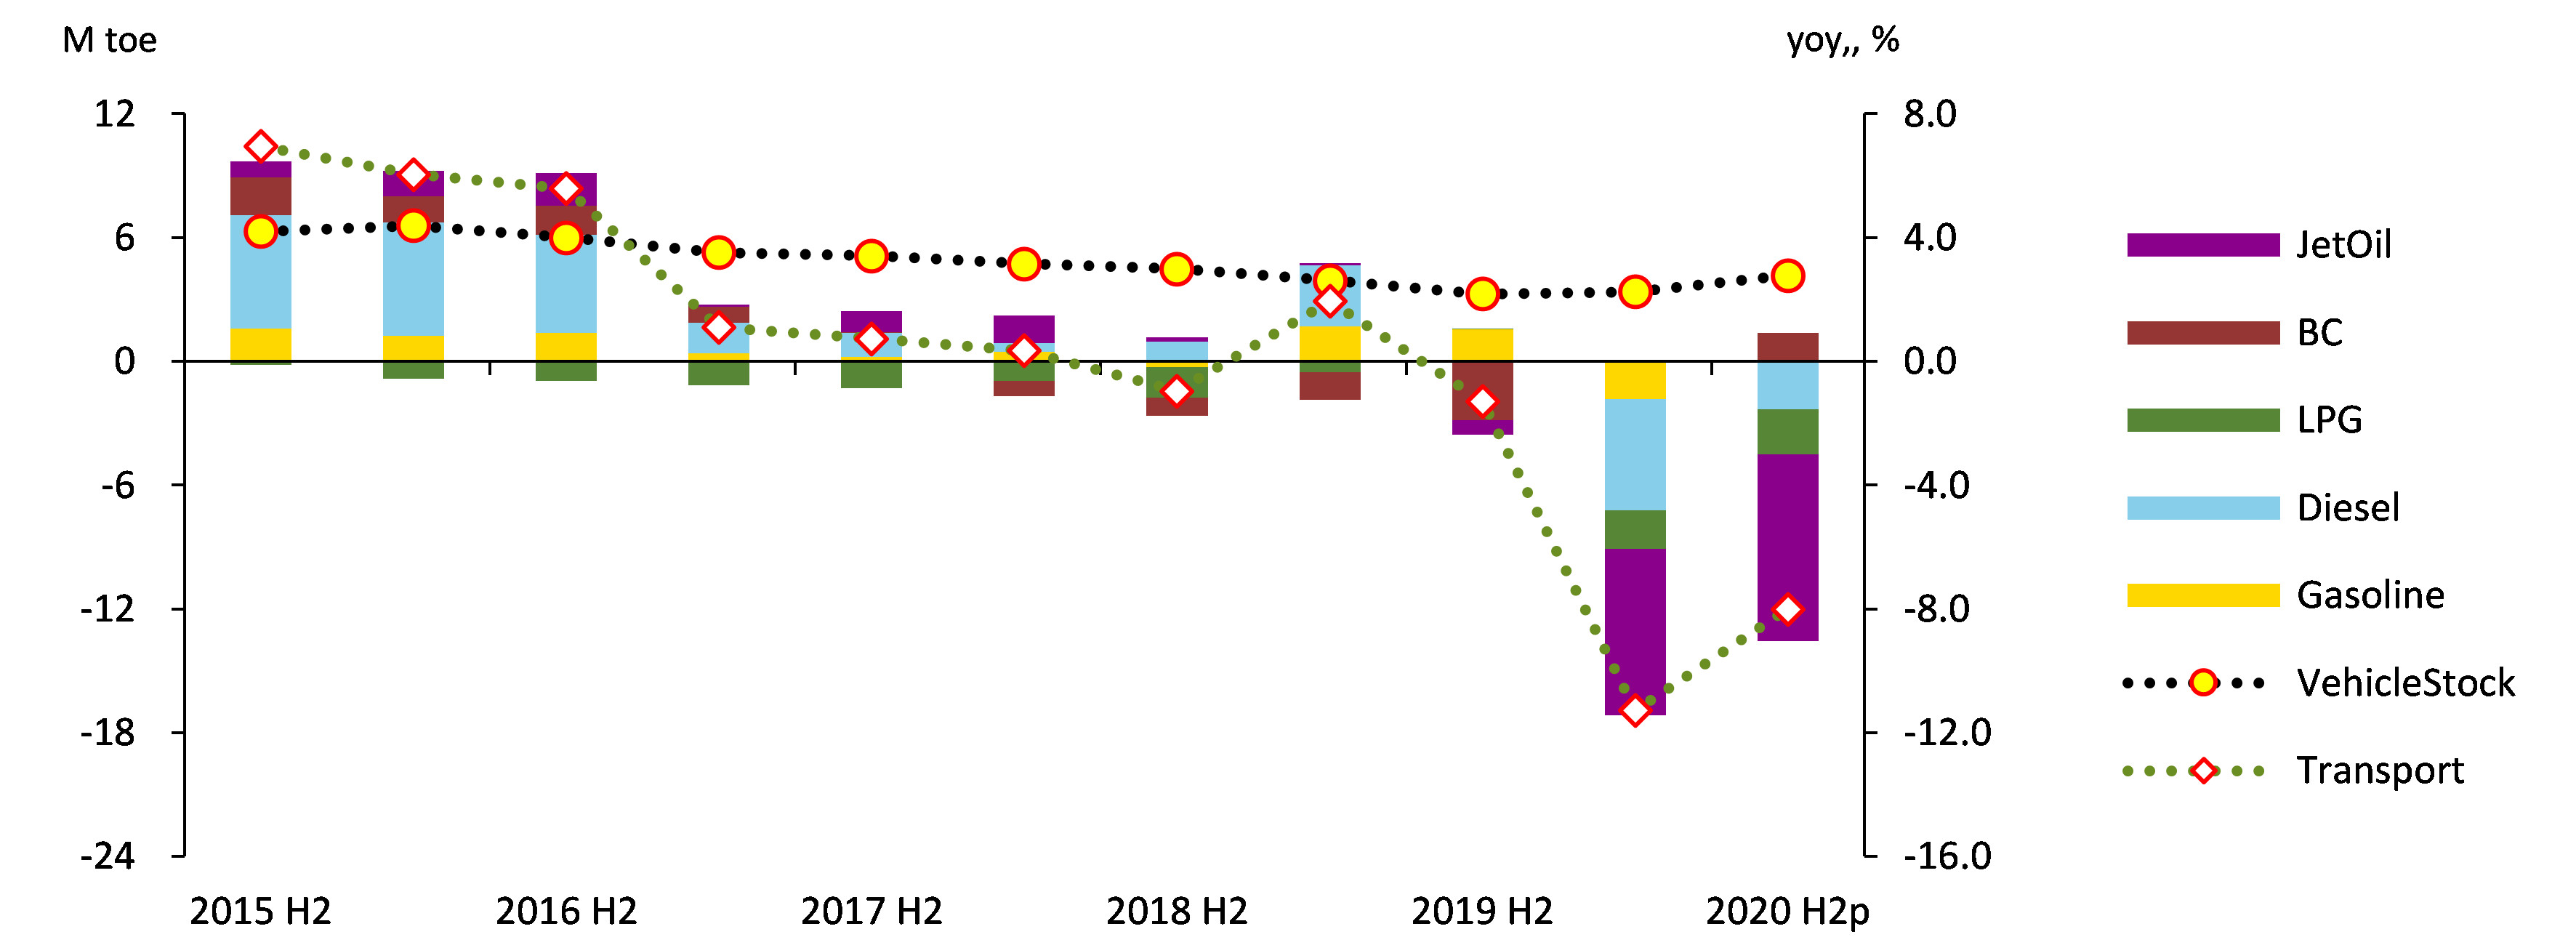
In 2021, with business and travel demand recovering, the demand for energy in the transport sector is expected to rebound fast mainly in the second half of the year
As more people get vaccinated and activities in the manufacturing and commercial sectors take off in the second half of this year, energy demand is likely to increase in road transport sector, excepting air transport sector, with increased travel demand
Heat Wave Scenario and Electricity Demand
If heat waves hit this summer as in 2018, electricity demand is expected to grow by 0.7%p compared to the base demand
After the intense heat waves in 2016 and 2018, concerns about possible heat waves and increase in electricity demand emerge as a social issue with summer approaching
According to the forecast issued by the Korea Meteorological Administration (KMA), there is a 50-70% chance the temperature this summer will be higher than the average year this summer
Recent trends of cooling degree days and assumptions per scenario
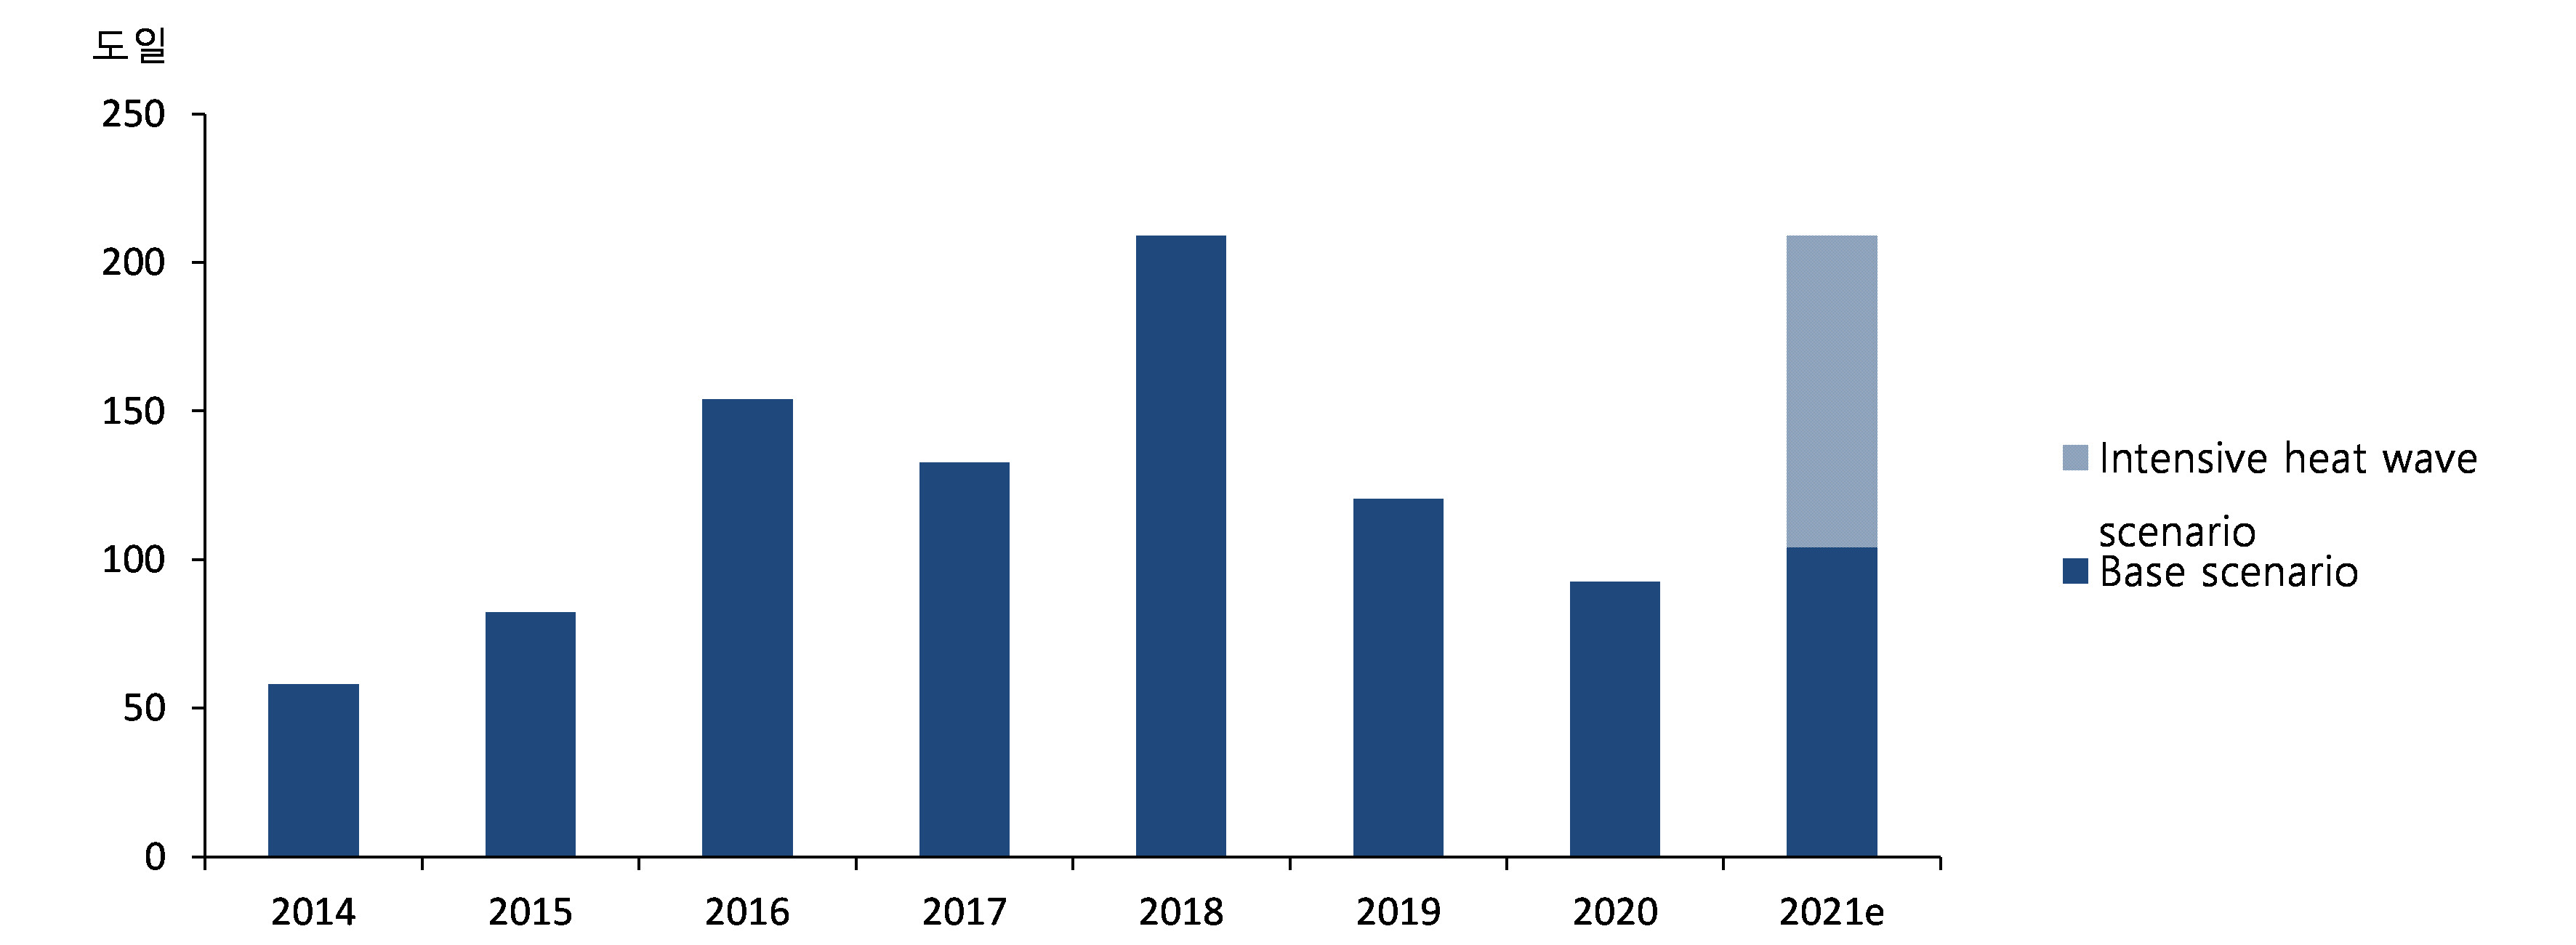
Note: The bottom of the cooling degree day bar of 2021 represents the number of possible cooling degree days assuming the average temperature of last ten years for this summer (‘Base scenario’) while the whole bar graph shows the value assuming that this summer will have the same number of cooling degree days as in 2018 (‘Intensive heat wave scenario’)
In the intensive heat wave scenario, if we make the assumption that 2021 has the same number of cooling degree days as in 2018 (209 cooling degree days), the cooling degree days this year will increase by 125.9% year-on-year
In the intensive heat wave scenario, the electricity demand growth is expected to be 4.0%, 0.7%p higher than the base scenario with the residential sector being the most affected by possible intensive heat waves
Continuous Reduction in Coal Power Generation
Driven by reduced fuel unit cost for natural gas generation and increased volume of renewable power generation, the share of coal generation is expected to continuously reduce
With natural gas price fall and increased volume of direct imports, the gap between fuel unit costs for coal and gas power generation has narrowed greatly
Fuel unit cost for major power sources
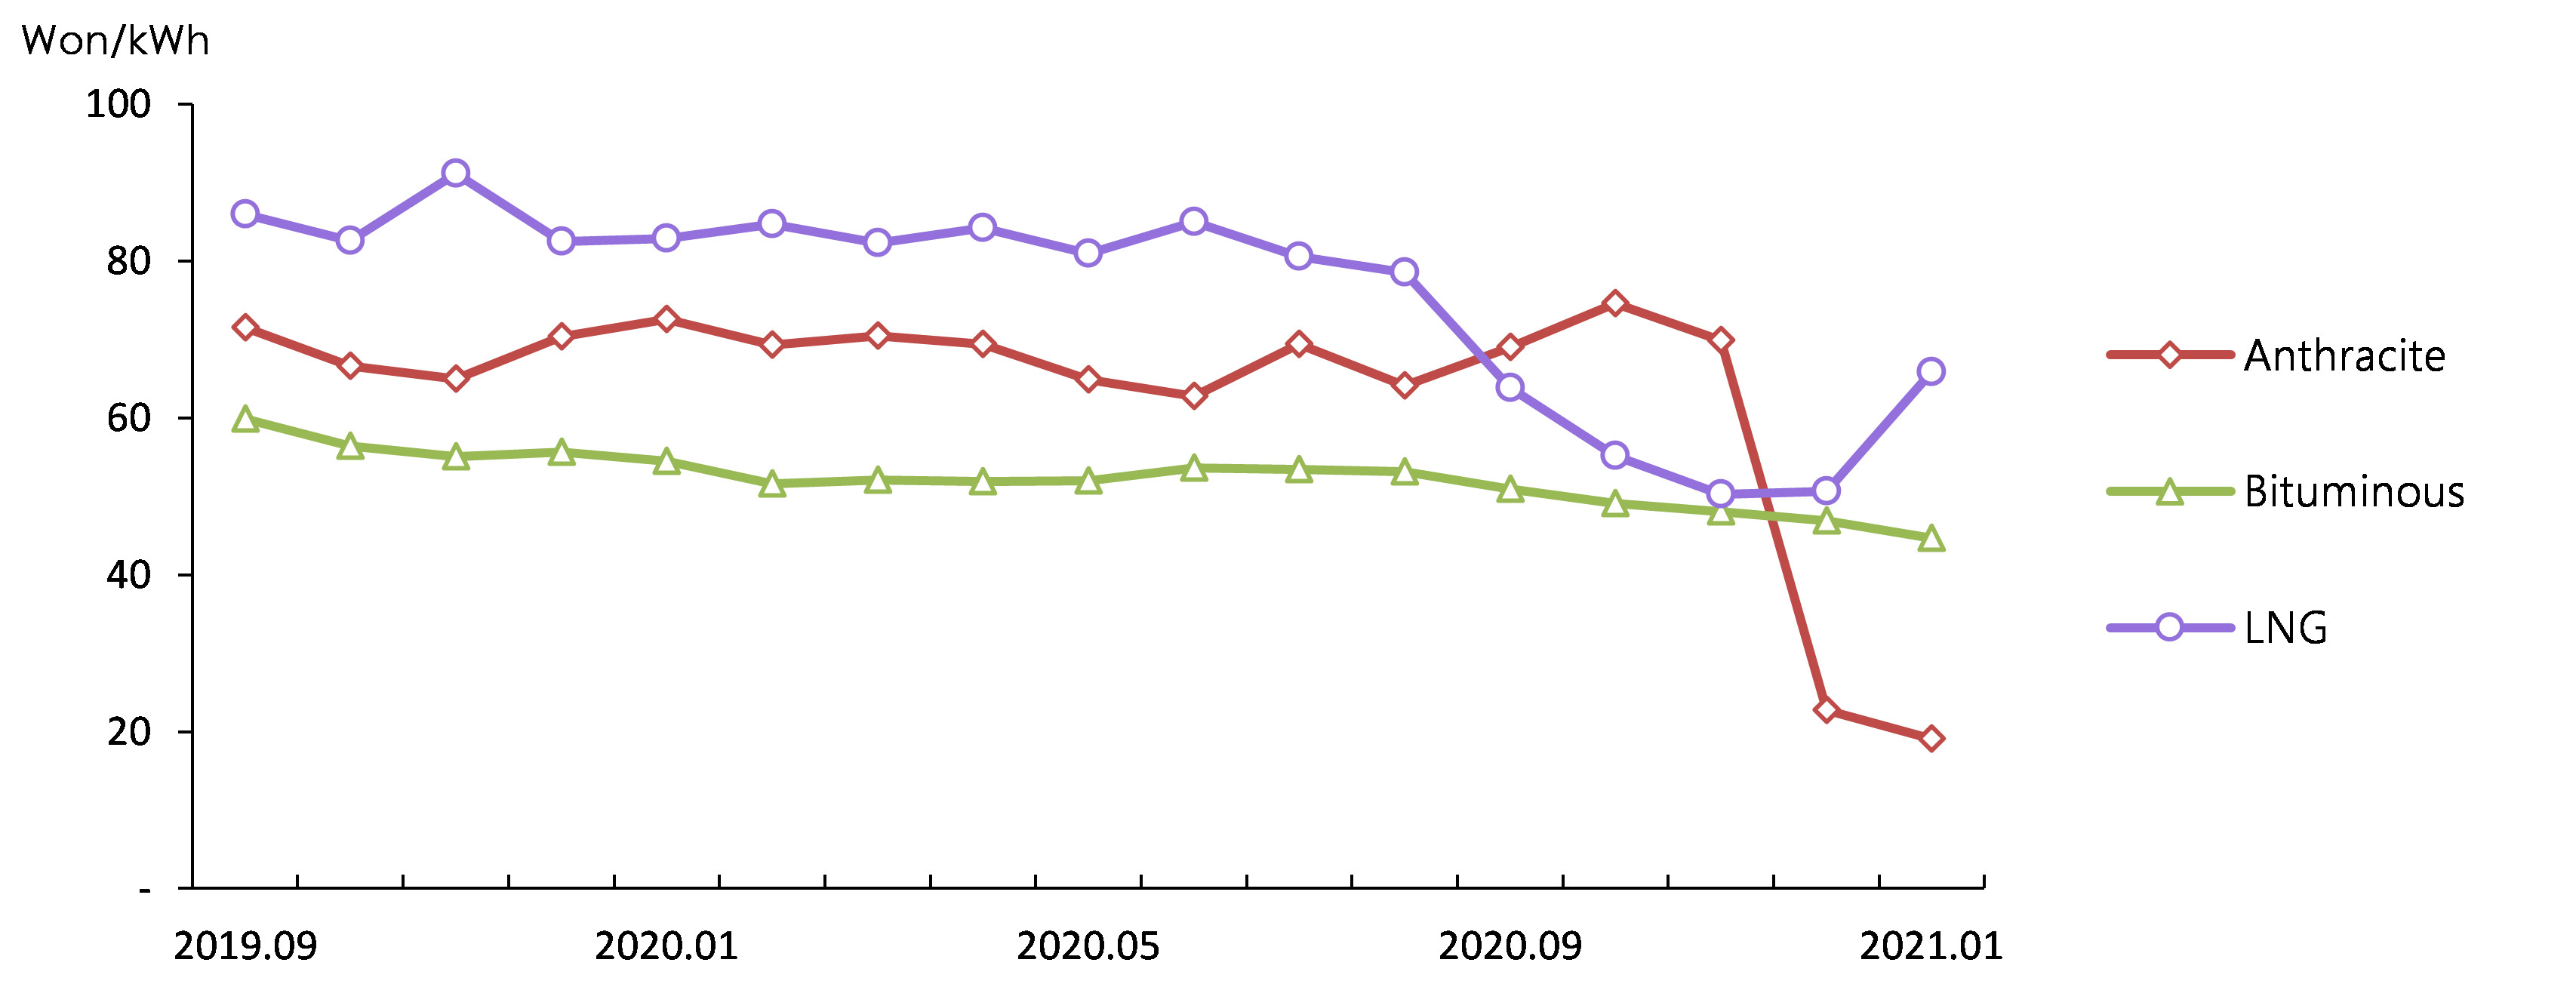
Direct imports of natural gas, which increased recently at a great speed, are likely to keep growing for a good while to become a factor in the decline of coal power generation, as LNG import price is anticipated to stay lower compared to the historical level
Volume and share of directly imported natural gas (%)
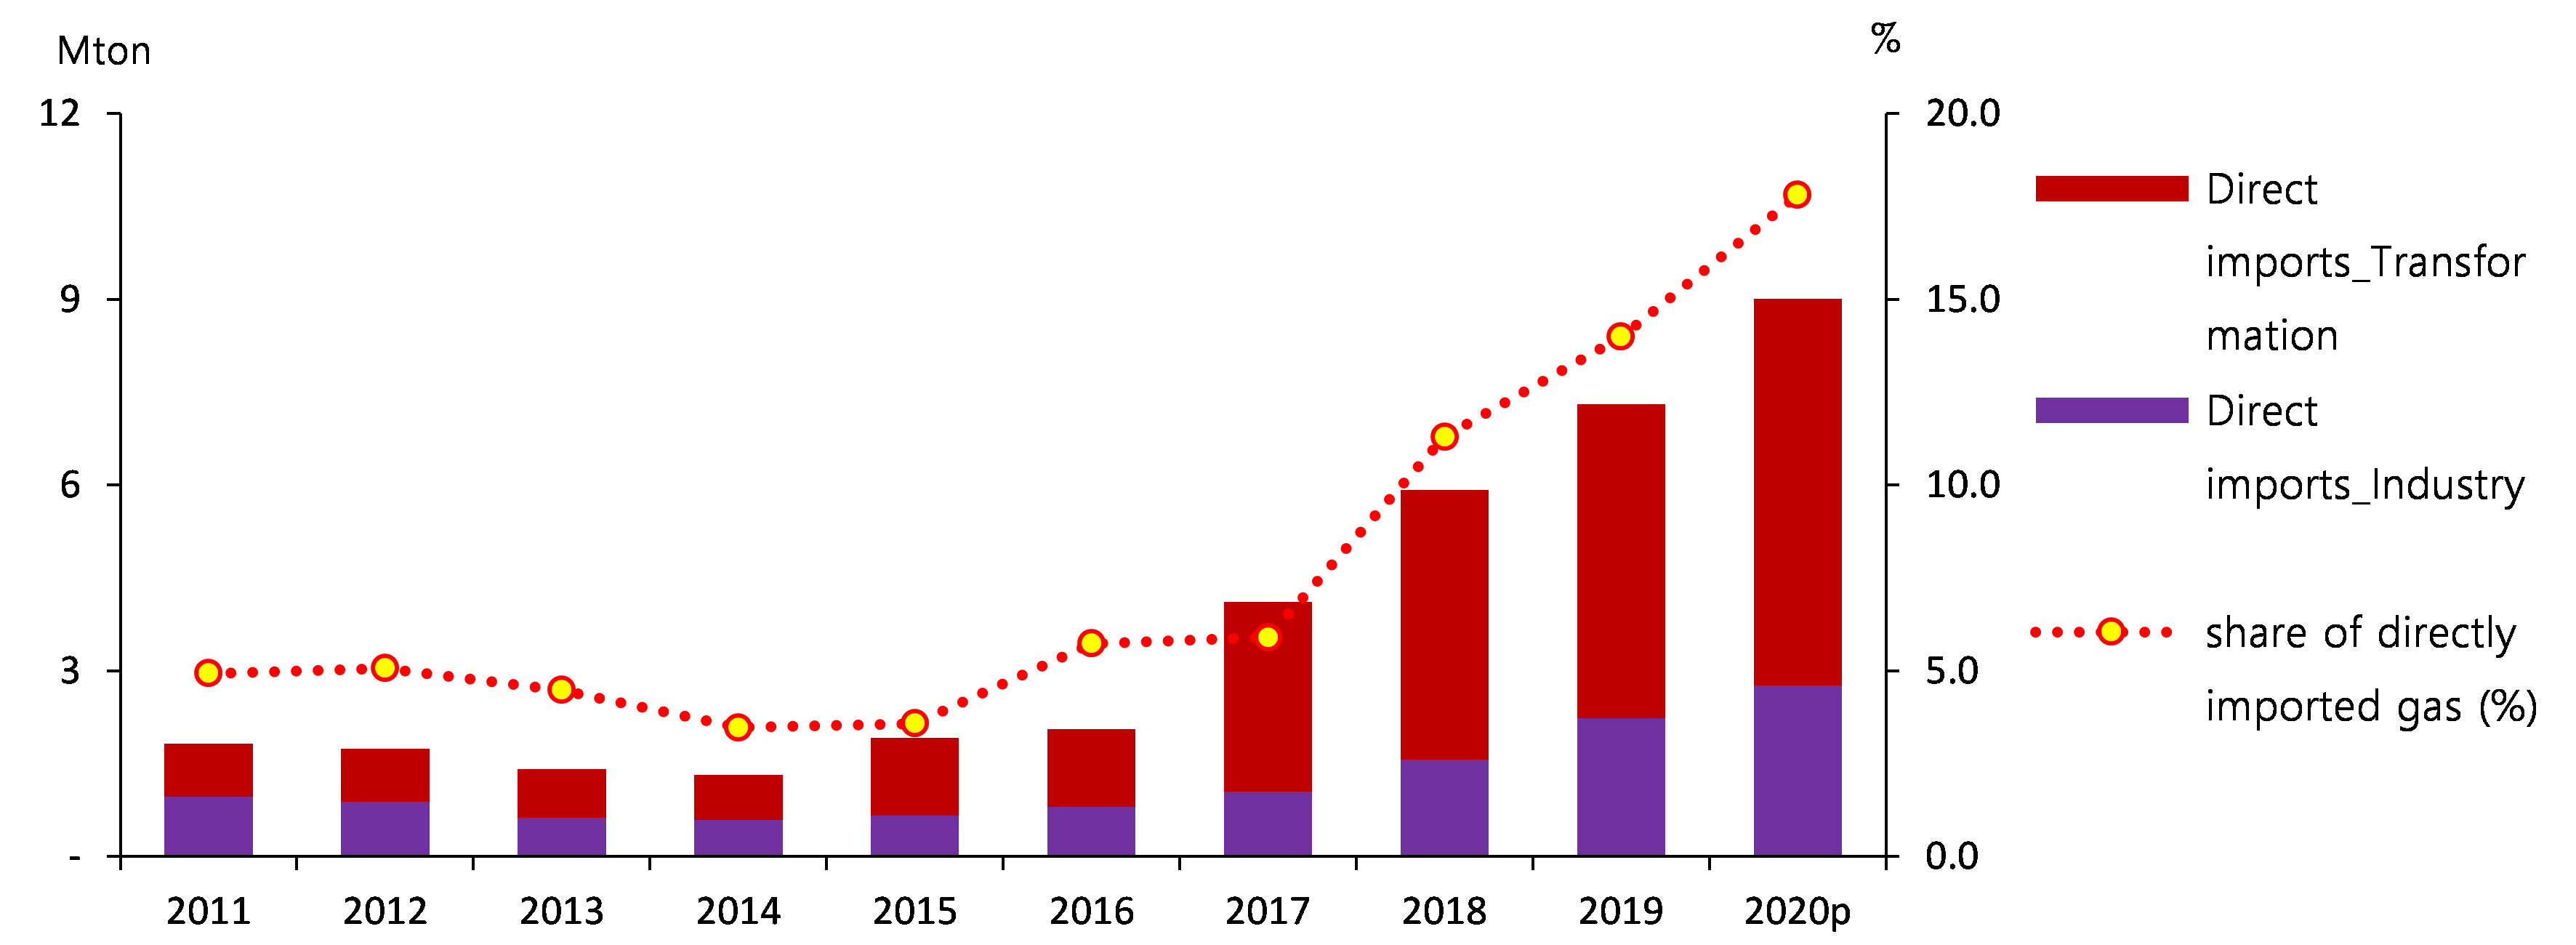
Coal-fired power plant shutdown and generation ceiling measures for climate and environment presentation, as well as a rise in renewable power have been playing an important role in the decline of coal power generation
Attachments-
T_단기_표지.png
Download
-
KoreaEnergyOutlook_2021_FirstHalf.pdf
Download
View Details
-
Energy Demand Outlook (2020, Second Half)
- Date2021/01/14
- Author Energy Demand and Supply Research Team
- Number of downloads 16
-
Download multiple files Download the entire file
Total Primary Energy Supply and Total Final Consumption[1]
Total Primary Energy Supply (“TPES”) declined by 4.1% and 3.4% respectively in 1H 2020 compared to the same period last year.
Energy use plunged in 1H 2020, as industrial and outdoor activities contracted due to the impact of COVID-19.
The growth rates of GDP, TPES and FEC trend
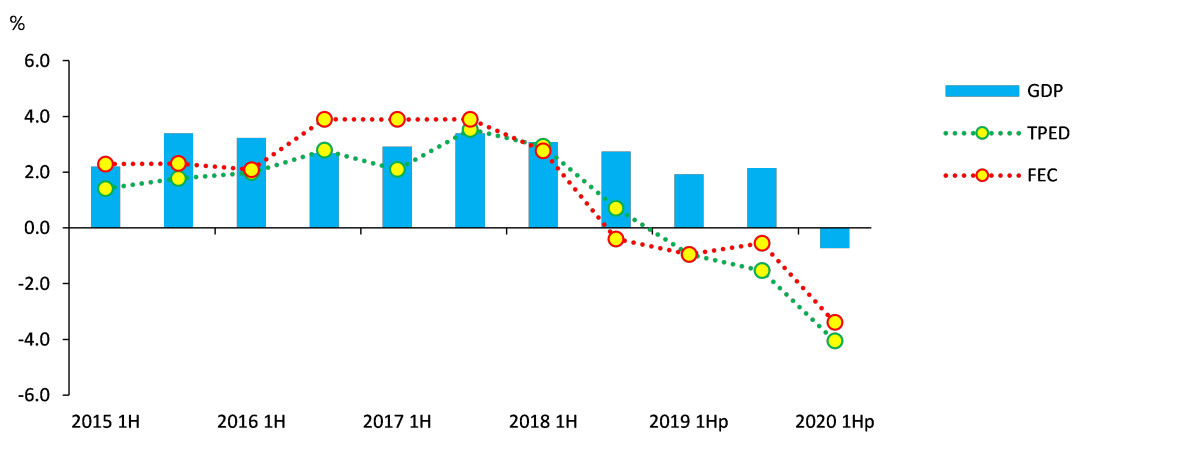
The use of nearly all major energy sources declined (in 1H 2020 on a year-on-year basis), and coal, among others, led the drop in TPES.
Coal use fell by 11.3% year-on-year, as its industrial demand declined due to the sluggish construction business, and as it dropped in the power generation sector amid falling power demand and the restrictions on the operation of coal-fired power plants as part of the government plans for electricity supply and demand in winter and reduction of coal-fired generation.
Petroleum use dropped by 3.0% year-on-year, as it declined in the transport sector, especially road transport and aviation, due to decreased travel demand amid the COVID-19 pandemic, although its industrial demand rose slightly despite sluggish industrial activity, because the use of LPG as petrochemical feedstock surged following the construction of new facilities.
Nuclear generation posted a year-on-year growth of 2.8%, owing to the commissioning of Shinkori unit 4(Aug. 2019), which has a 1.4GW capacity. Renewable and ‘the other’ energy use grew by 3.7% as a result of the government policies that encourage the deployment of renewable energy.
Gas use fell by 2.5% year-on-year, as it dropped in the power generation sector despite decreased baseload generation due to falling power demand amid the economic slowdown, triggered by the COVID-19 pandemic, and as final city gas use decreased in a dire economic situation as a result of the pandemic and because of weak price competitiveness amid low oil prices.
Electricity use went down by 2.9% year-on-year, owing to the falling demand in the industrial and commercial sectors, affected by mild weather at the beginning of the year and the impact of COVID-19 since March, although residential electricity use increased, because people spent more time at home during the pandemic.
The growth rate of TPES and energy sources
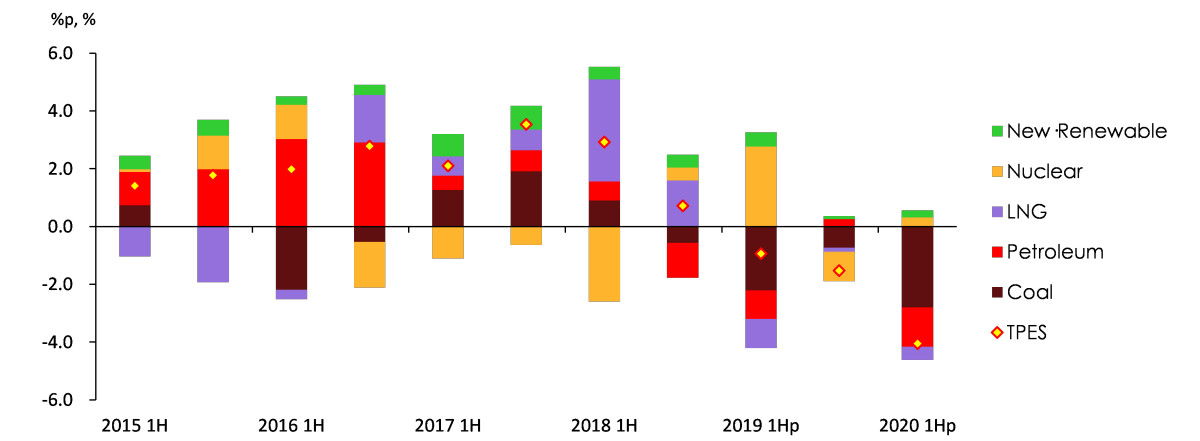
As for the final energy use in 1H 2020, it declined in the industrial, transport and buildings sectors all together.
Industrial energy use fell by 1.9% year-on-year, owing to the sluggish production in large energy-consuming sectors amid the global economic downturn caused by COVID-19.
Transport energy use was down 11.2% year-on-year, led by the road transport and aviation sectors as a result of ‘social distancing’ measures and a sharp fall in demand for overseas travel.
Buildings’ energy use slid by 0.8%, which was affected by a fast decline in the number of heating degree days and the COVID-19 outbreak at the beginning of the year.
The growth rate of TFC by end-use sectors
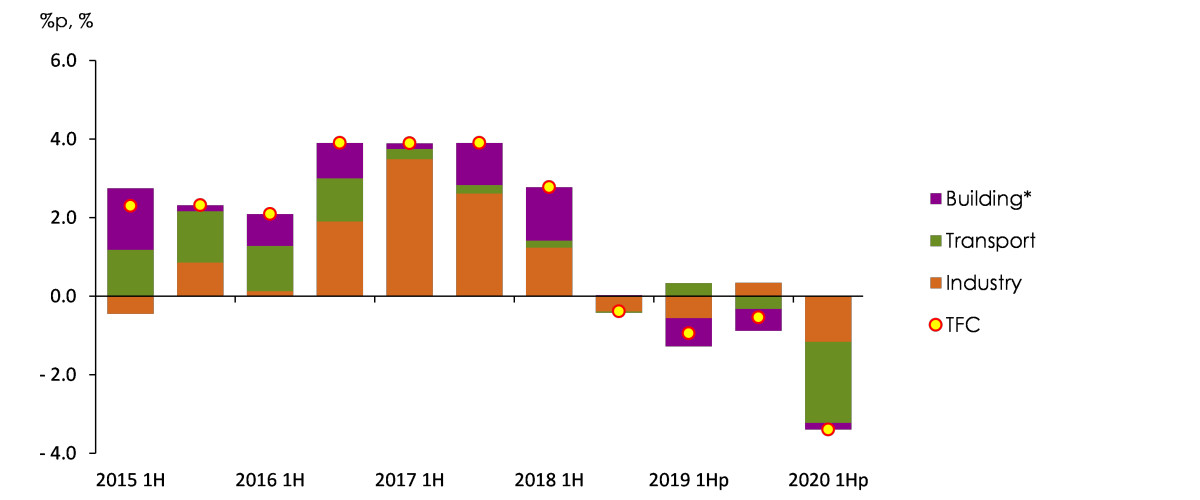
* Building’s energy use refers to the total amount of energy used in residential, commercial, public and other buildings.
TPES & TFC Outlook
TPES is forecast to contract by 4.6% in 2020 and then rebound by 4.1% in 2021.
In 2020, TPES will continue the downward trend of the previous year due to the impact of COVID-19, posting two consecutive years of declines for the first time since energy balance was presented.
In 2021, however, TPES is likely to rebound, as the economy and society gradually recover from the shock of the COVID-19 pandemic with the development of vaccines.
The growth rates of GDP, TPES and TFC, trend and outlook
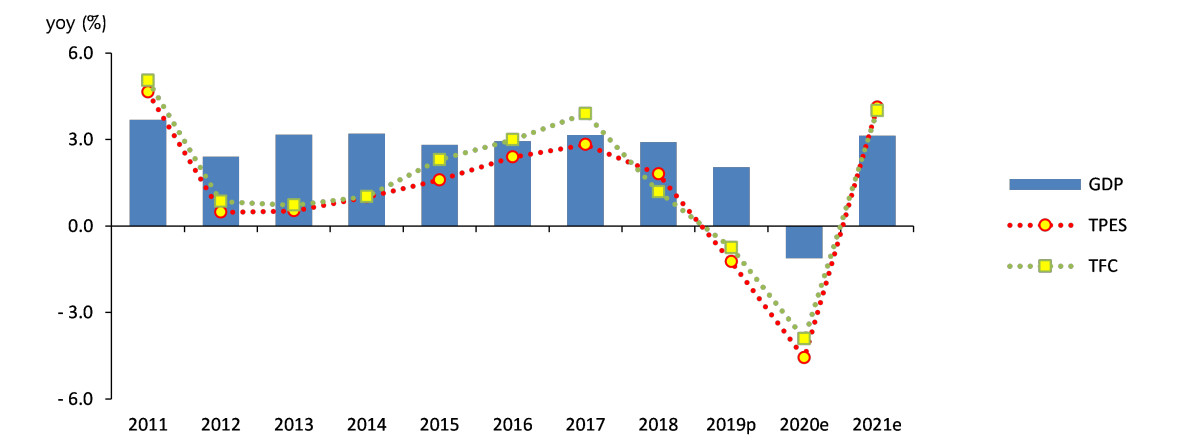
Energy intensity(toe/KRW1million) will rapidly improve in 2020 for the second consecutive year, as energy consumption declines faster than Gross Domestic Product(“GDP”), and then it is expected to slightly increase in 2021 partly due to base effect.
Demand growth is expected for most energy sources except coal.
Petroleum demand is projected to fall by 5.1% in 2020, mostly in the transport sector, due to social distancing measures that were introduced to address COVID-19. In 2021, however, the demand is to rebound by 4.4%, led by strong demand growth in the industrial and trnapsort sectors.
Coal demand will decline by nearly 10% in 2020, as it plunges in the power generation and steelmaking sectors. In 2021, the decline rate will drop to over 2%, driven by demand recovery in the steelmaking sector due to base effect, though the downward slide continues in the power generation sector.
Nuclear generation is forecast to grow by around 7% in 2020 and 11% in 2021 as a result of the commissioning of a new large reactor.
Natural gas demand is expected to dwindle by around 6% in 2020, led by the city gas production and power generation sectors. In 2021, however, it will grow by over 7%, as the demand grows in both sectors.
Electricity demand will drop by almost 3% in 2020, mostly in the industrial and commercial sectors and then it will bounce back by almost 4% in 2021 partly due to the economic recovery and the base effect of the two consecutive years of declines.
The growth rate of TPES & contributions by sources
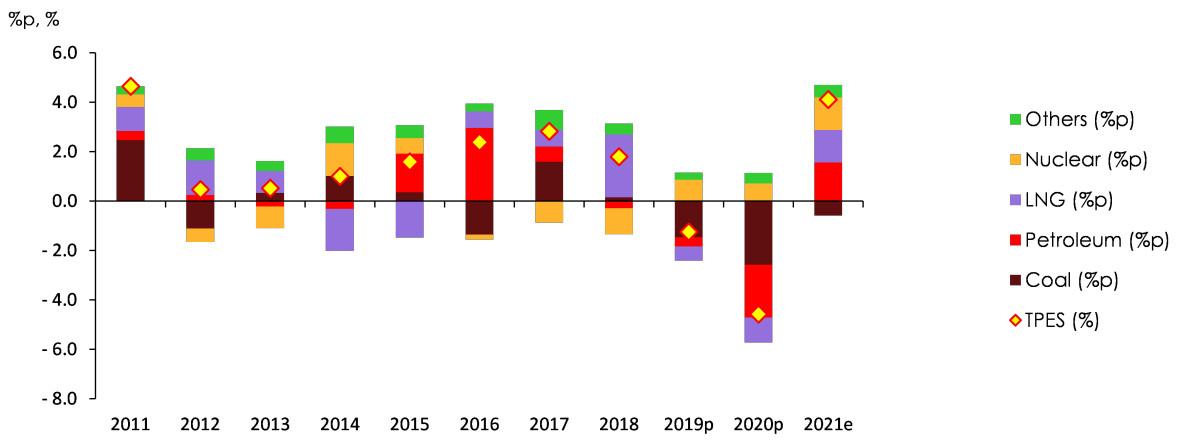
Final energy demand will decrease by 3.9% in 2020, and then it will increase by 4.0% in 2021.
Industrial energy demand is forecast to decline by around 3% in 2020 owing to a slowdown in industrial production amid the COVID-19 pandemic. In 2021, it will grow by around 4% with the recovery of the economy.
The change and growth rate of TFC by energy sources and end-use sectors, 2020 and 2021

Energy demand for transport will contract by above 10% in 2020 from the previous year, especially in the road transport and aviation sectors, due to the impact of the COVID-19 pandemic, and then it will rebound by over 5% in 2021, as travel demand returns mostly in the second half of the year.
Energy demand in buildings will remain flat for 2020 amid contrasting impact of COVID-19 in the residential and commercial sectos along with the impact of the heating and cooling degree days. In 2021, it will grow by around 2.5%.
Key Features and Implications
The COVID-19 crisis had the most profound impact on energy demand in 2020.
During the ongoing COVID-19 pandemic, transport energy use plunged due to a rapid drop in travel demand, and industrial energy use also declined as a result of sluggish production amid the global economic slowdown. In the buildings’ sector, energy use declined in commercial buildings affected by social distancing measures, while it grew slightly in residential buildings with more time spent at home.
This chapter is thoroughly discussing the impact of COVID-19 on energy demand by sectors in 2020 and in the following years.
Transport
The transport sector was directly hit by COVID-19, and its energy use dropped by 10.6% in 1H 2020 on a year-on-year basis.
The closure of international routes and social distancing measures taken to contain the virus led to a sharp fall in travel demand, and accordingly, energy use plunged mostly in the road transport and aviation sectors.
In 2021, transport energy demand is expected to grow in line with the economic recovergy, though the demand may remain stagnant for some time in the aviation sector.
As the number of vaccinated people rises in 2021, travel demand is expected to grow along with the economic recovery. In the aviation sector, however, the recovery could take much longer depending on the vaccination rates in other countries.
Transport petroleum use by sub-sectors
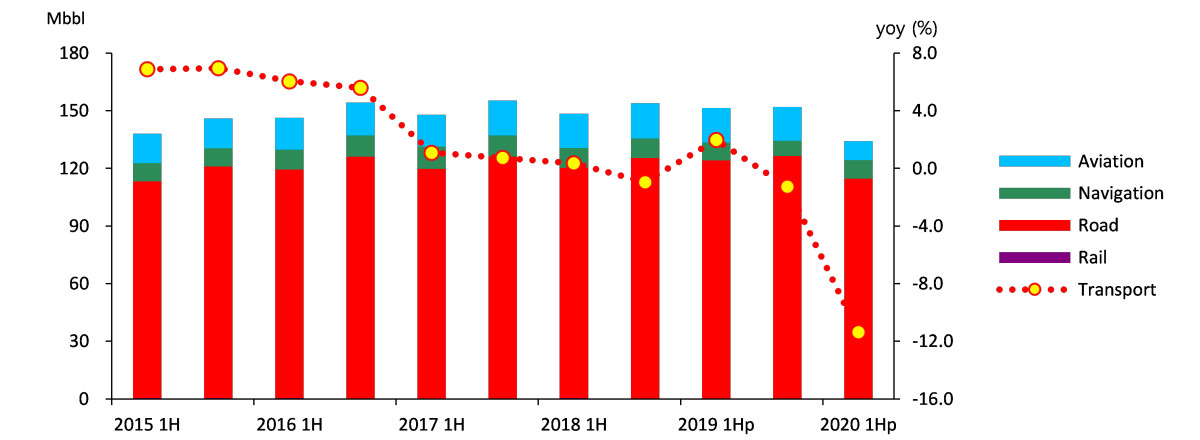
Since the COVID-19 pandemic started, new trends have been emerging from the social distancing experiences, which affect transport energy demand.
The covid-19 pandemic will keep bringing about new trends affecting energy demand such as preference for personal cars over public transrpot; growing use of deliverty service and falling travel demand due to increased teleworking.
Industry
The impact of COVID-19 on industrial energy demand appeared to be more indirect than direct.
As the virus is spreading throughout the country, a growing number of factories are being closed after employees tested positive. Still, the impact on energy use seems to be limited, as the closure continues only for 1-3 days in most cases.
Industrial energy consumption & production index
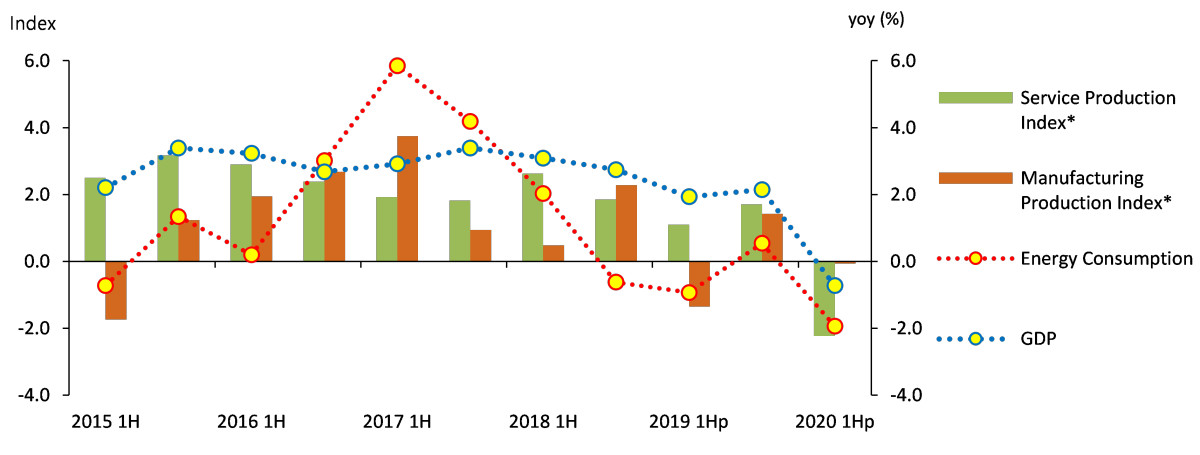
Industrial energy use fell sharply owing to the indirect impact of COVID-19: the demand declined in the domestic and global markets, and the domestic manufacturing activities contracted amid the covid-19 crisis.
The future energy demand in the industrial sector will be influenced by the pandemic situation both at home and abroad.
Industrial energy demand will be heavily influenced by the developments of the COVID-19 pandemic, since domestic industry is affected by not just domestic demand but also export demand.
Buildings
Buildings energy use fell by 0.8% year-on-year in 1H 2020 as a result of the social distancing measures and decreased number of heating degree days.
Buidlings energy use dropped at the beginning of 2020 with mild weather(Jan-Feb), but later it increased, as people spent more time at home due to social distancing measure taken to slow the COVID-19 outbreak that started in late February. As a result, buildings’ energy use posted a slight decline in 1H 2020.
Petroleum use increased in buildnigs, as domestic petroleum product prices declined in line with the sharp drop in global oil price.
Petroleum use in buildings grew by 4.5% year-on-year in 1H 2020, because petroleum product prices declined amid the COVID-19 crisis, and it grew by 18.5% from March to June when the virus raged on.
The use of energy, except petroleum, increased in residential buildings while decreased in commercial & public buildings both because of the COVID-19 pandemic.
Excluding petroleum consumption that surged due to global oil price plunge, destorting the consumption trend, the buildings sector witnessed a contrasting impact of COVID-19 on its energy demand: the demand increased in residential buildings while decreased in commercial buildings since the outbreak started in full swing in March due to the social distancing measures and longer stay at home.
Energy consumption in buildings & major indicators /h4>
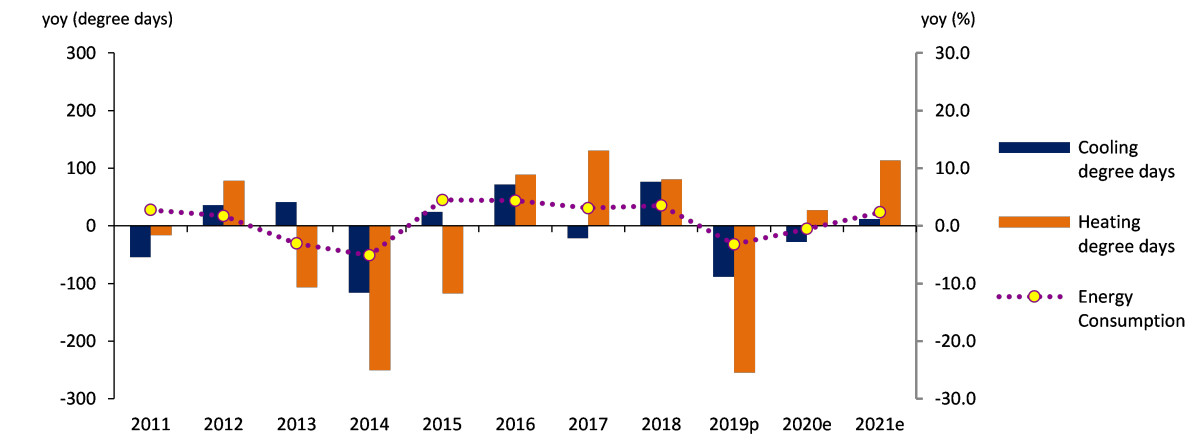
In 2021, buildings’ energy use will depend on the spread of COVID-19 and the begining of the vaccination process.
Energy use will continue to increase in residential buidlings and decrease in commercial and public buildings from 4Q 2020 to 1Q 2021, as the number of confirmed cases are rising fast amid the third wave of the pandemic
Buildings’ energy use is projected to fall by 0.5% in 2020, but it is to rise by 2.4% in 2021 assuming the year’s temperature to be the ten-year average, thouth the COVID-19 situation could largely change the growth rate.
[1] Growth rates of TPES and TFC by energy sources and sectors could be converted to tonnes of oil equivalent, and therefore they could be diffrent from those measured with own unit of energy in (KEEI’s) reports on energy trend and outlook by energy sources.
Attachments-
_에너지수요전망_2020하반기_표지.png
Download
-
KoreaEnergyOutlook_2020_SecondHalf.pdf
Download
View Details
-
Energy Demand Outlook (2020, First Half)
- Date2020/06/30
- Author Energy Demand and Supply Research Team
- Number of downloads 16
-
Download multiple files Download the entire file
Total Primary Energy Supply and Total Final Consumption[1]
Total Primary Energy Supply (“TPES”) fell by 1.3% to 303.5 Mtoe in 2019 from the previous year.
TPES declined for the first time since 1998, which was attributed to the stagnant industrial & service production in the midst of the economic slowdown, increased preventive maintenance at petrochemecial facilities and weather conditions.
The growth rates of GDP and TPES, production index
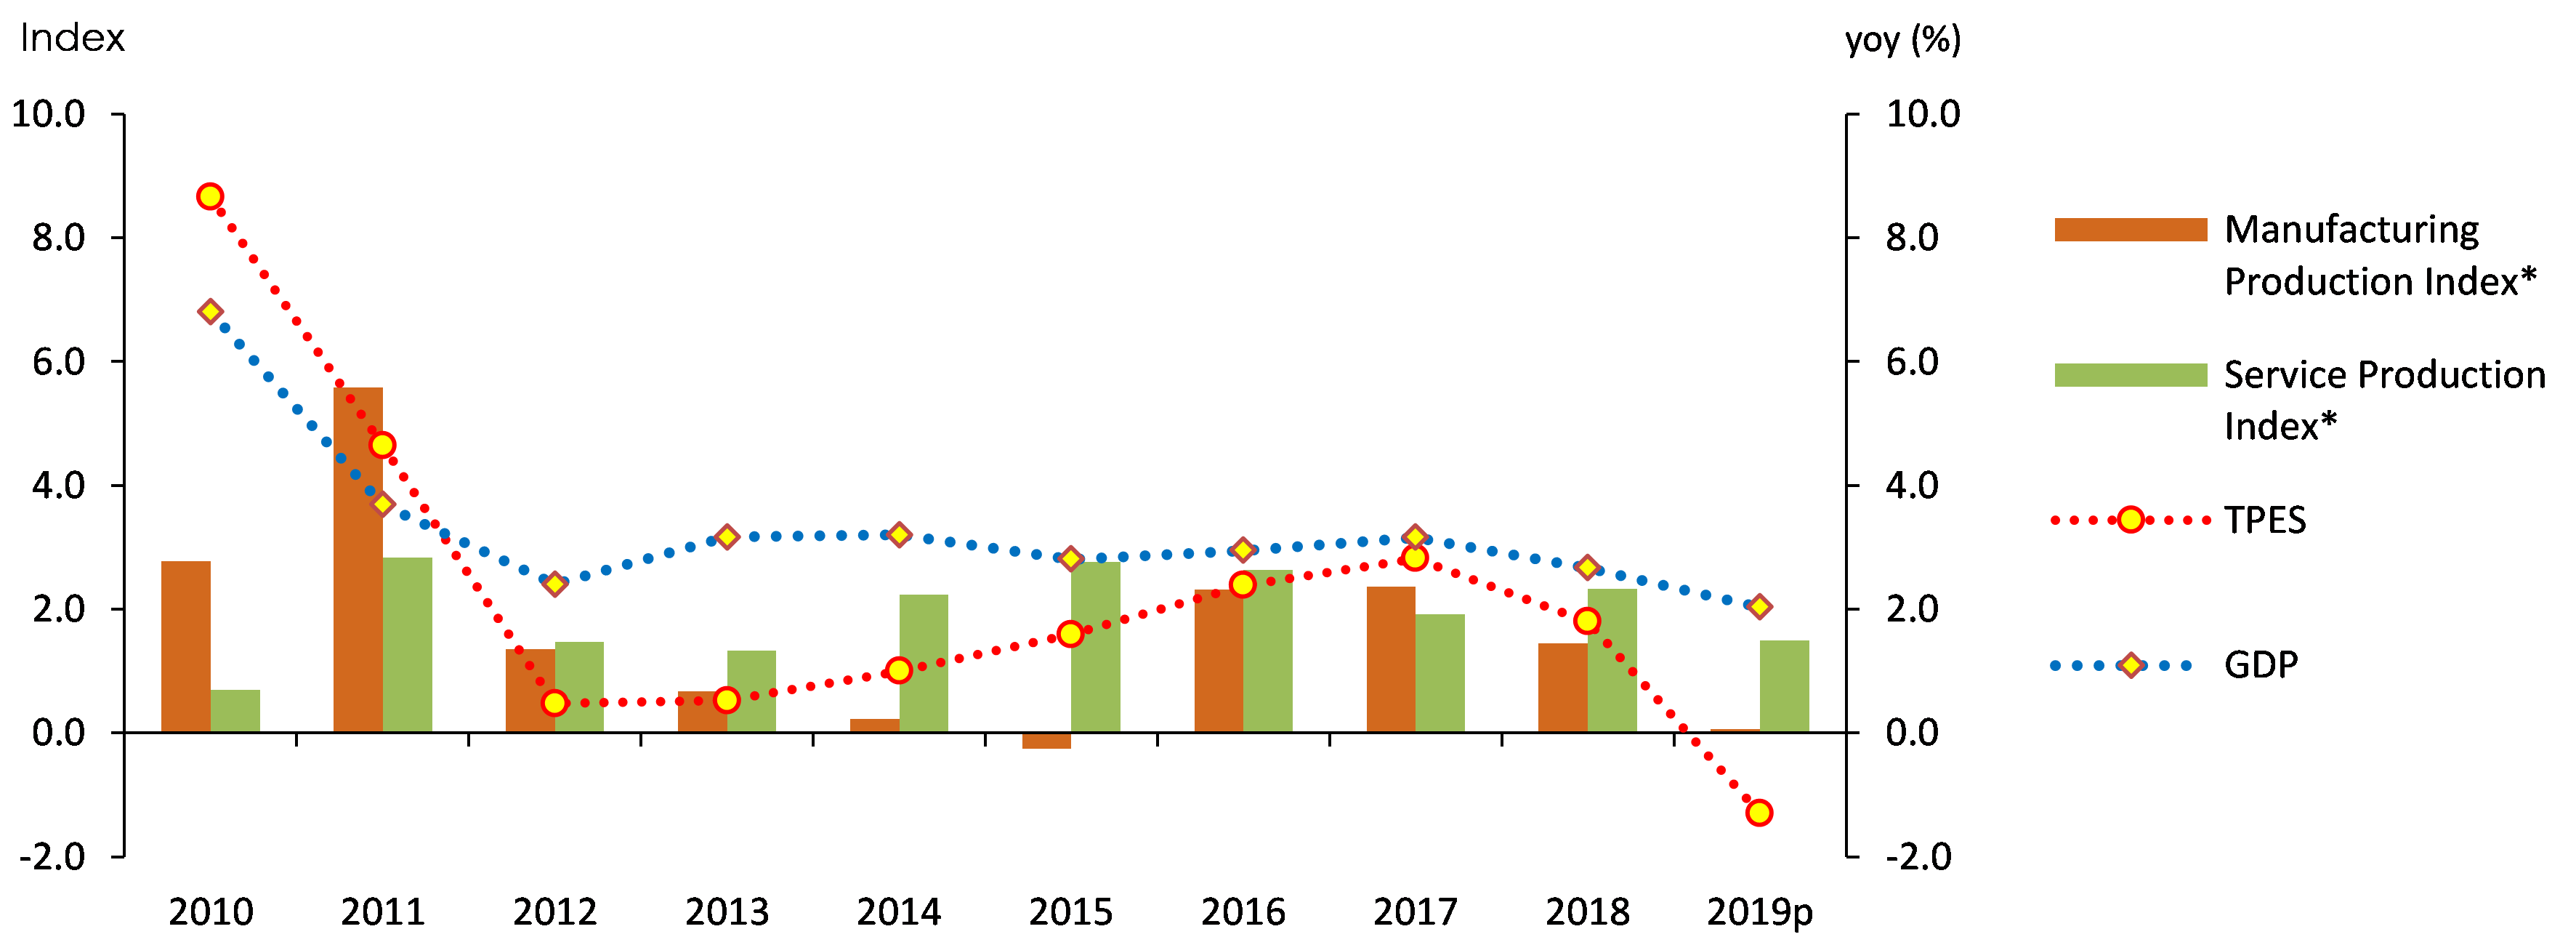
Nuclear and renewable energy use increased, and petroleum use was almost at the prior-year level, while the use of coal and gas decreased.
Petroleum use fell by 0.3%, led by the domestic navigation sector where the use of fuel oil plunged due to the enforcement of the International Maritime Organization’s environmental regulations (“IMO 2020”) IMO decided to ban ships from using fuel oil with a sulfur content above 0.5% from 2020. The previous limit was 3.5%. , although it slightly increased in the industrial sector, with surging LPG use offsetting a drop in naphtha use, which takes a large share of the total industrial petroleum use.
Coal use dropped by 5.7% year-on-year in 2019, as its industrial demand fell slightly partly due to weak production, and the demand fell more sharply in the power generation sector owing to the increased preventive maintenance, shutdown of some plants for safety issues and a cap on coal power generation as part of the government’s fine dust mitigation efforts.
Nuclear generation was up 9.3% year-on-year in 2019, as the total installed capacity increased (6.4%) with the commissioning of Shinkori unit 4 (Aug. 2019), and the average capacity factor also increased, with several reactors restarting after maintenance.
CGas use slid by 3.2% year-on-year in 2019, as it rapidly declined in the power generation sector due to weak power demand and the high base effect from last year (21.5%) as well as increased nuclear generation, and as it also declined in the city gas production sector owing to a drop in heating demand amid mild winter.
End-use of electricity fell by 1.1% year-on-year in 2019, as it declined in both of the industrial and buildings sectors; electricity use grew at slower pace in the fabricated metals and petrochemical sectors, and it dropped faster in the primary metals sector; the number of heating & cooling degree days plunged, and the service production index grew more slowly.
The growth rate of TPES by energy sources
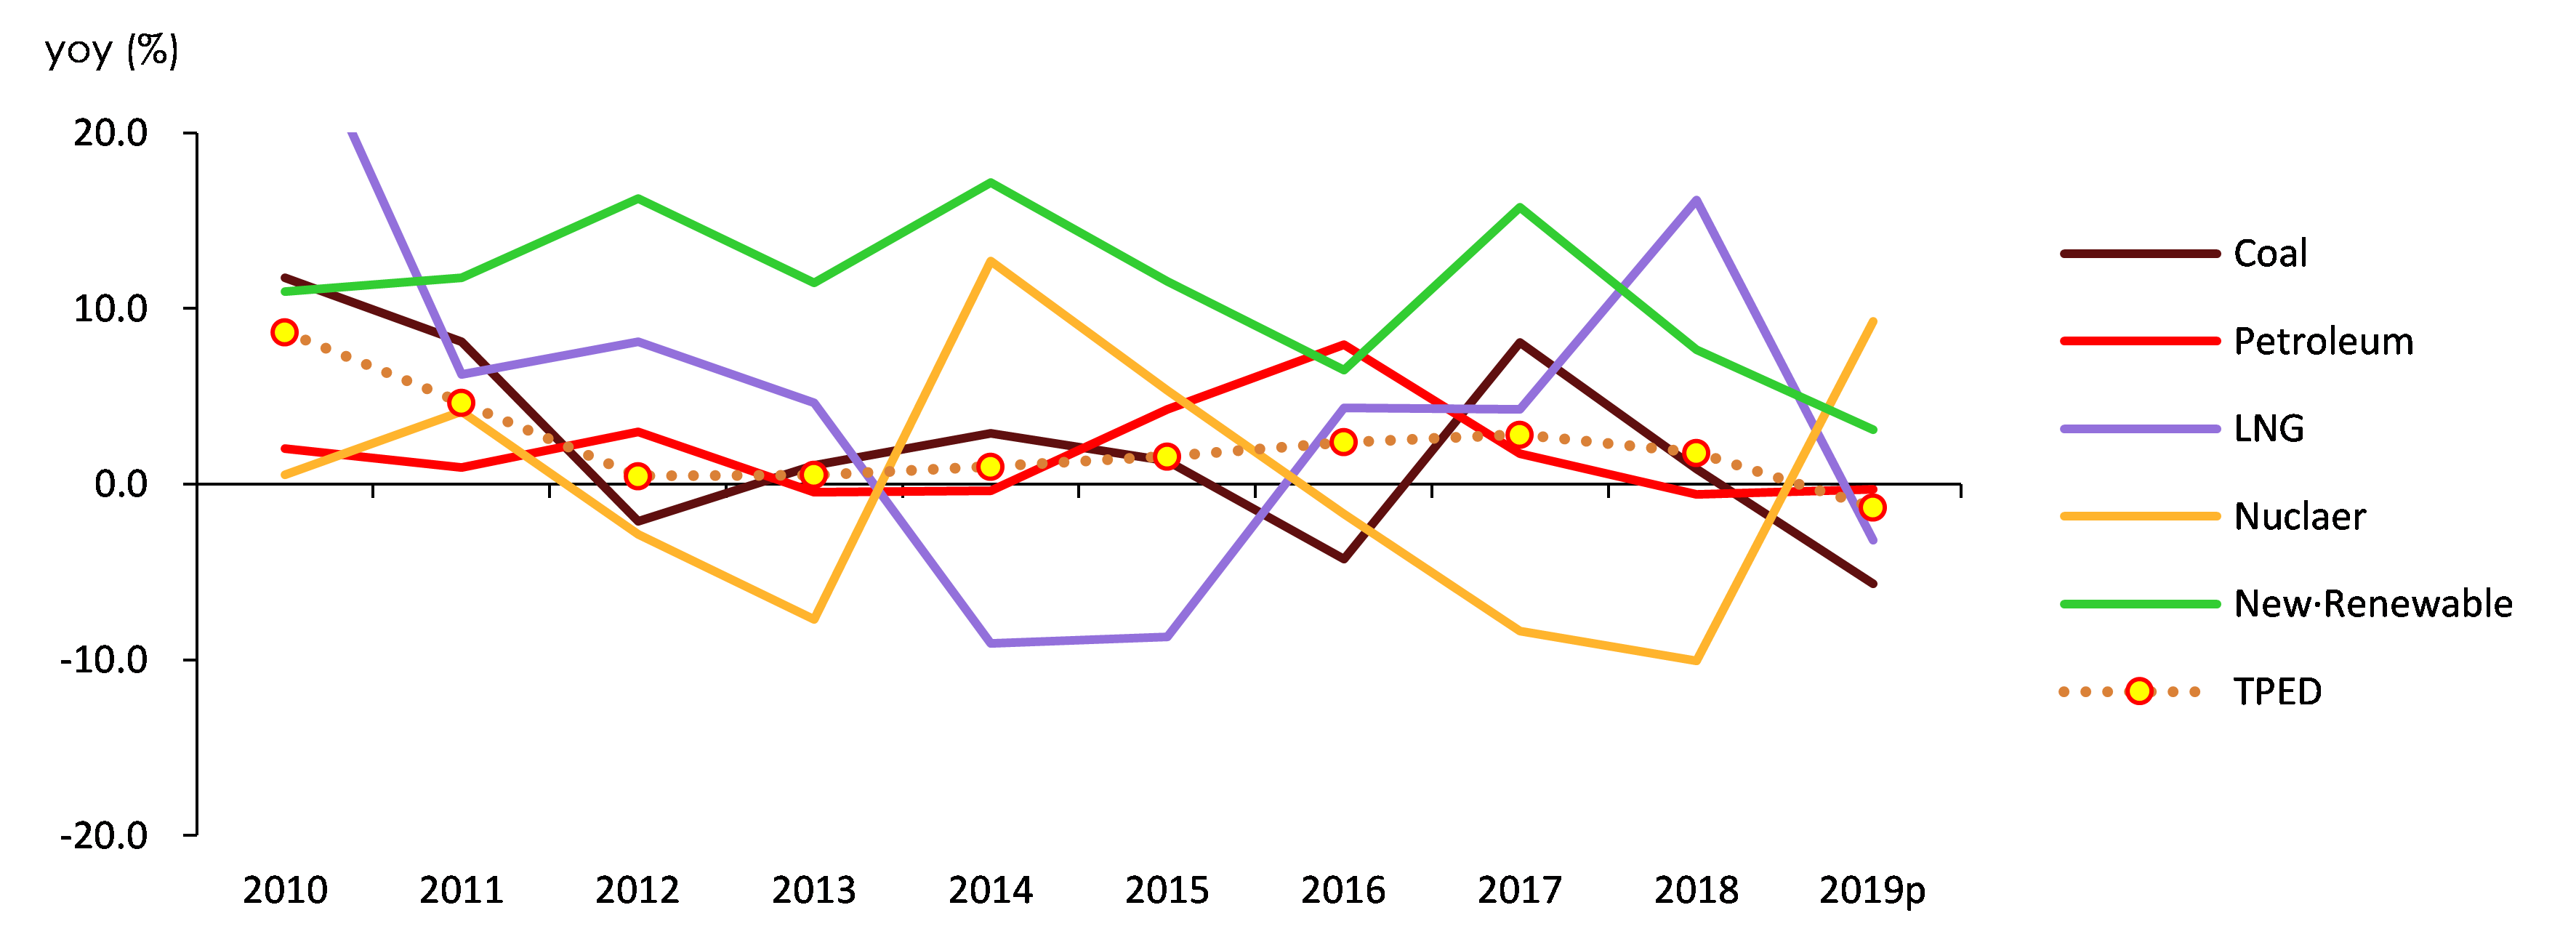
Total Final Consumption (“TFC”) dropped by 0.6% year-on-year in 2019, as the consumption declined in all the end-use sectors.
Industrial energy use fell by 0.1% in 2019 from the previous year, as naphtha use declined due to increased maintenance work at naphtha cracking centers, although the use of bituminous coal for steelmaking slightly increased owing to the base effect.
Transport energy use declined by 0.9% year-on-year in 2019, led by a sharp drop in the domestic navigation sector as a result of IMO’s environmental regulation, although it slightly increased in the road transport sector, because petroleum product prices decreased due to the global oil price decrease and temporary fuel tax cut.
Buildings’ energy use declined by 2.0% year-on-year in 2019, as the number of heating and cooling degree days plunged compared to the previous year which experienced both scorching heat and extremely cold weather.
The growth rate of TFC by end-use sectors
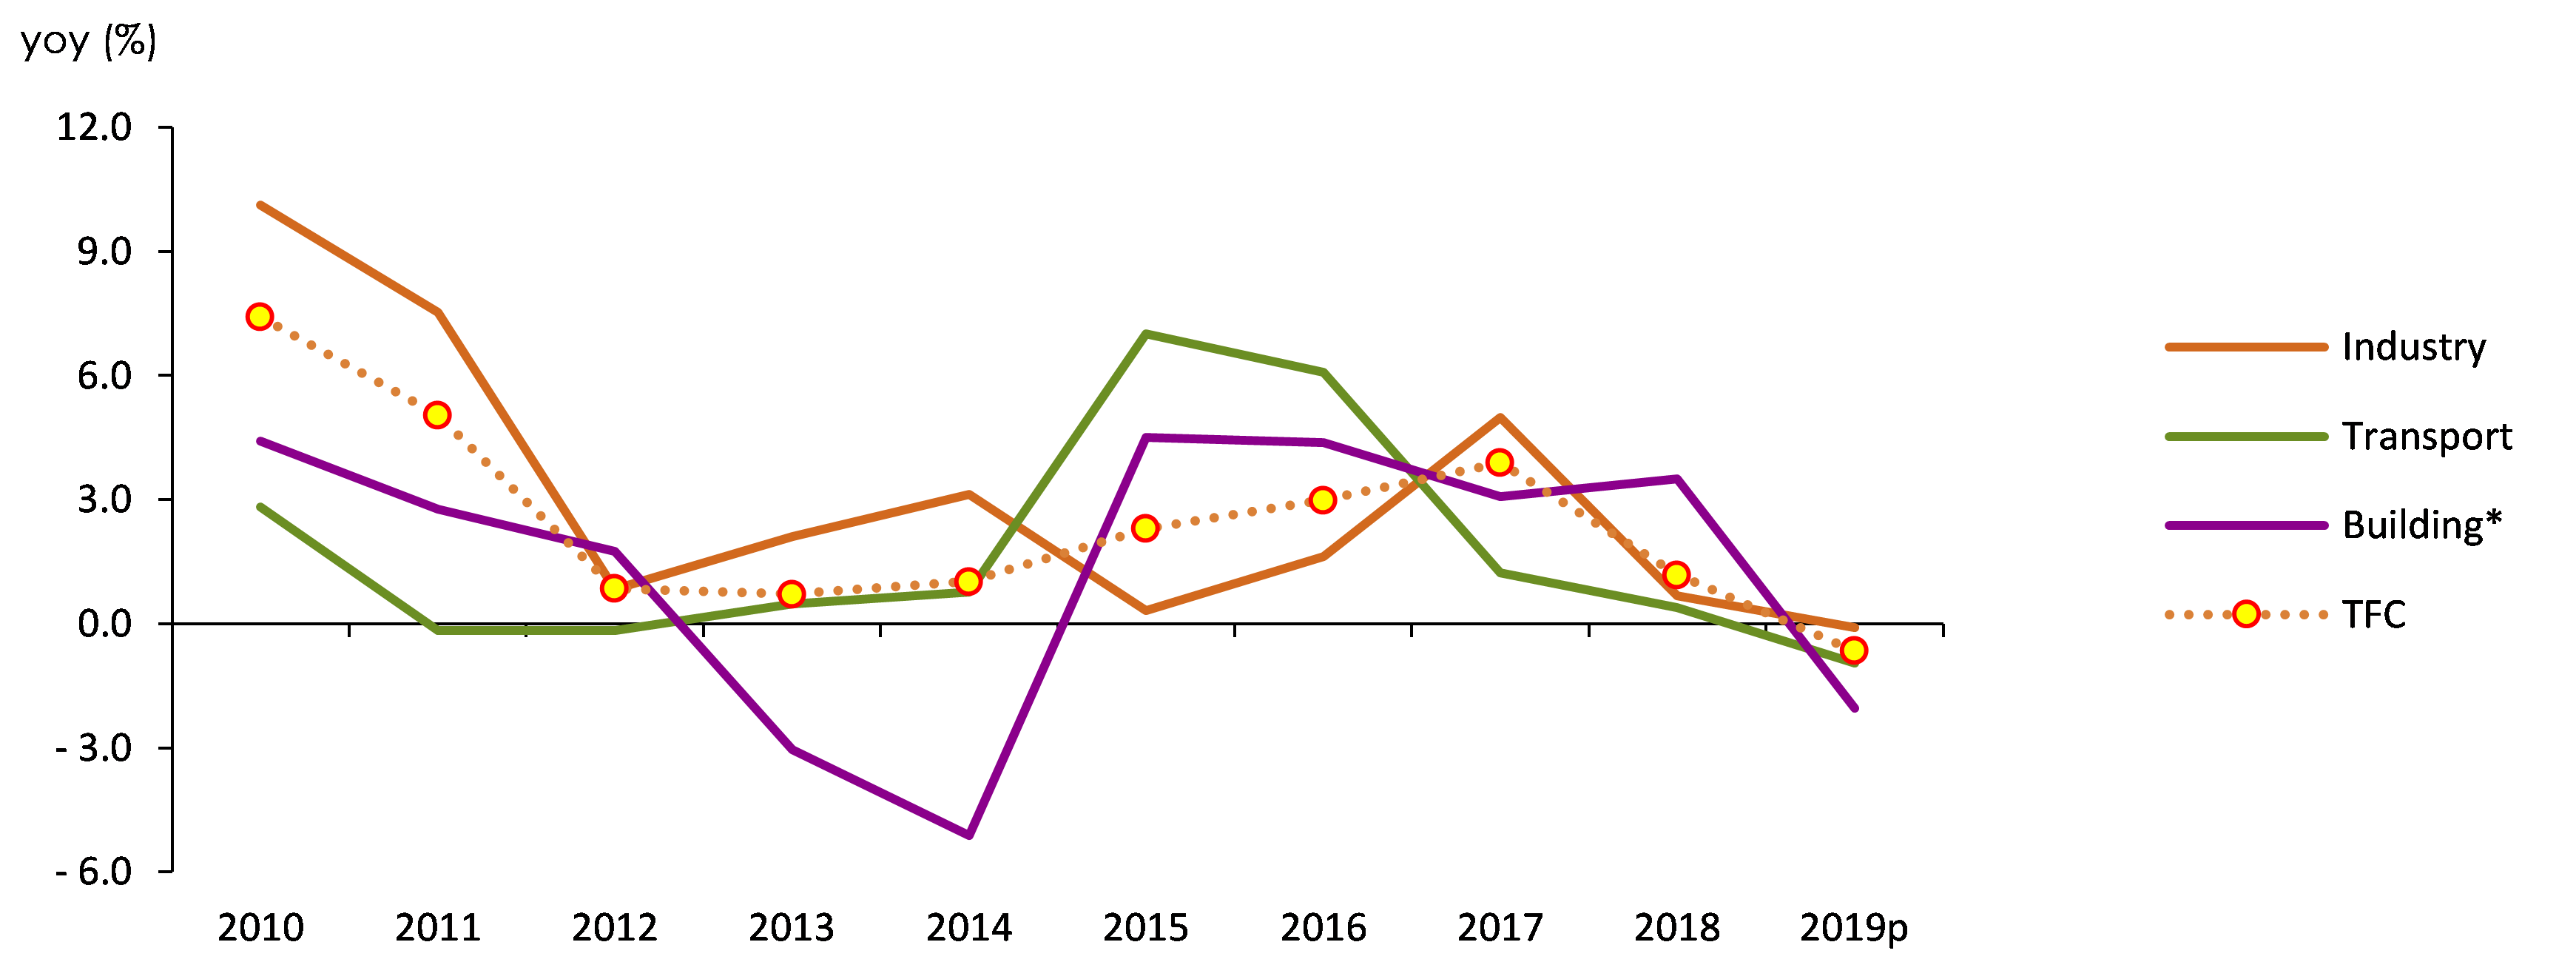
TPES & TFC Outlook
TPES and TFC are expected to drop by 1.4% and 1.3% respectively in 2020 on a year-on-year basis.
TPES and TFC are likely to drop for the 2nd consecutive year in 2020, owing to a slowdown in industrial and service production, hit by the COVID-19 pandemic, and a drop in transport demand during the social distancing period.
Energy consumption rate (toe/ KRW 1 million) is expected to grow at much slower pace in 2020 due to the high base effect of the previous year.
The growth rates of GDP, TPES and TFC, trend and outlook
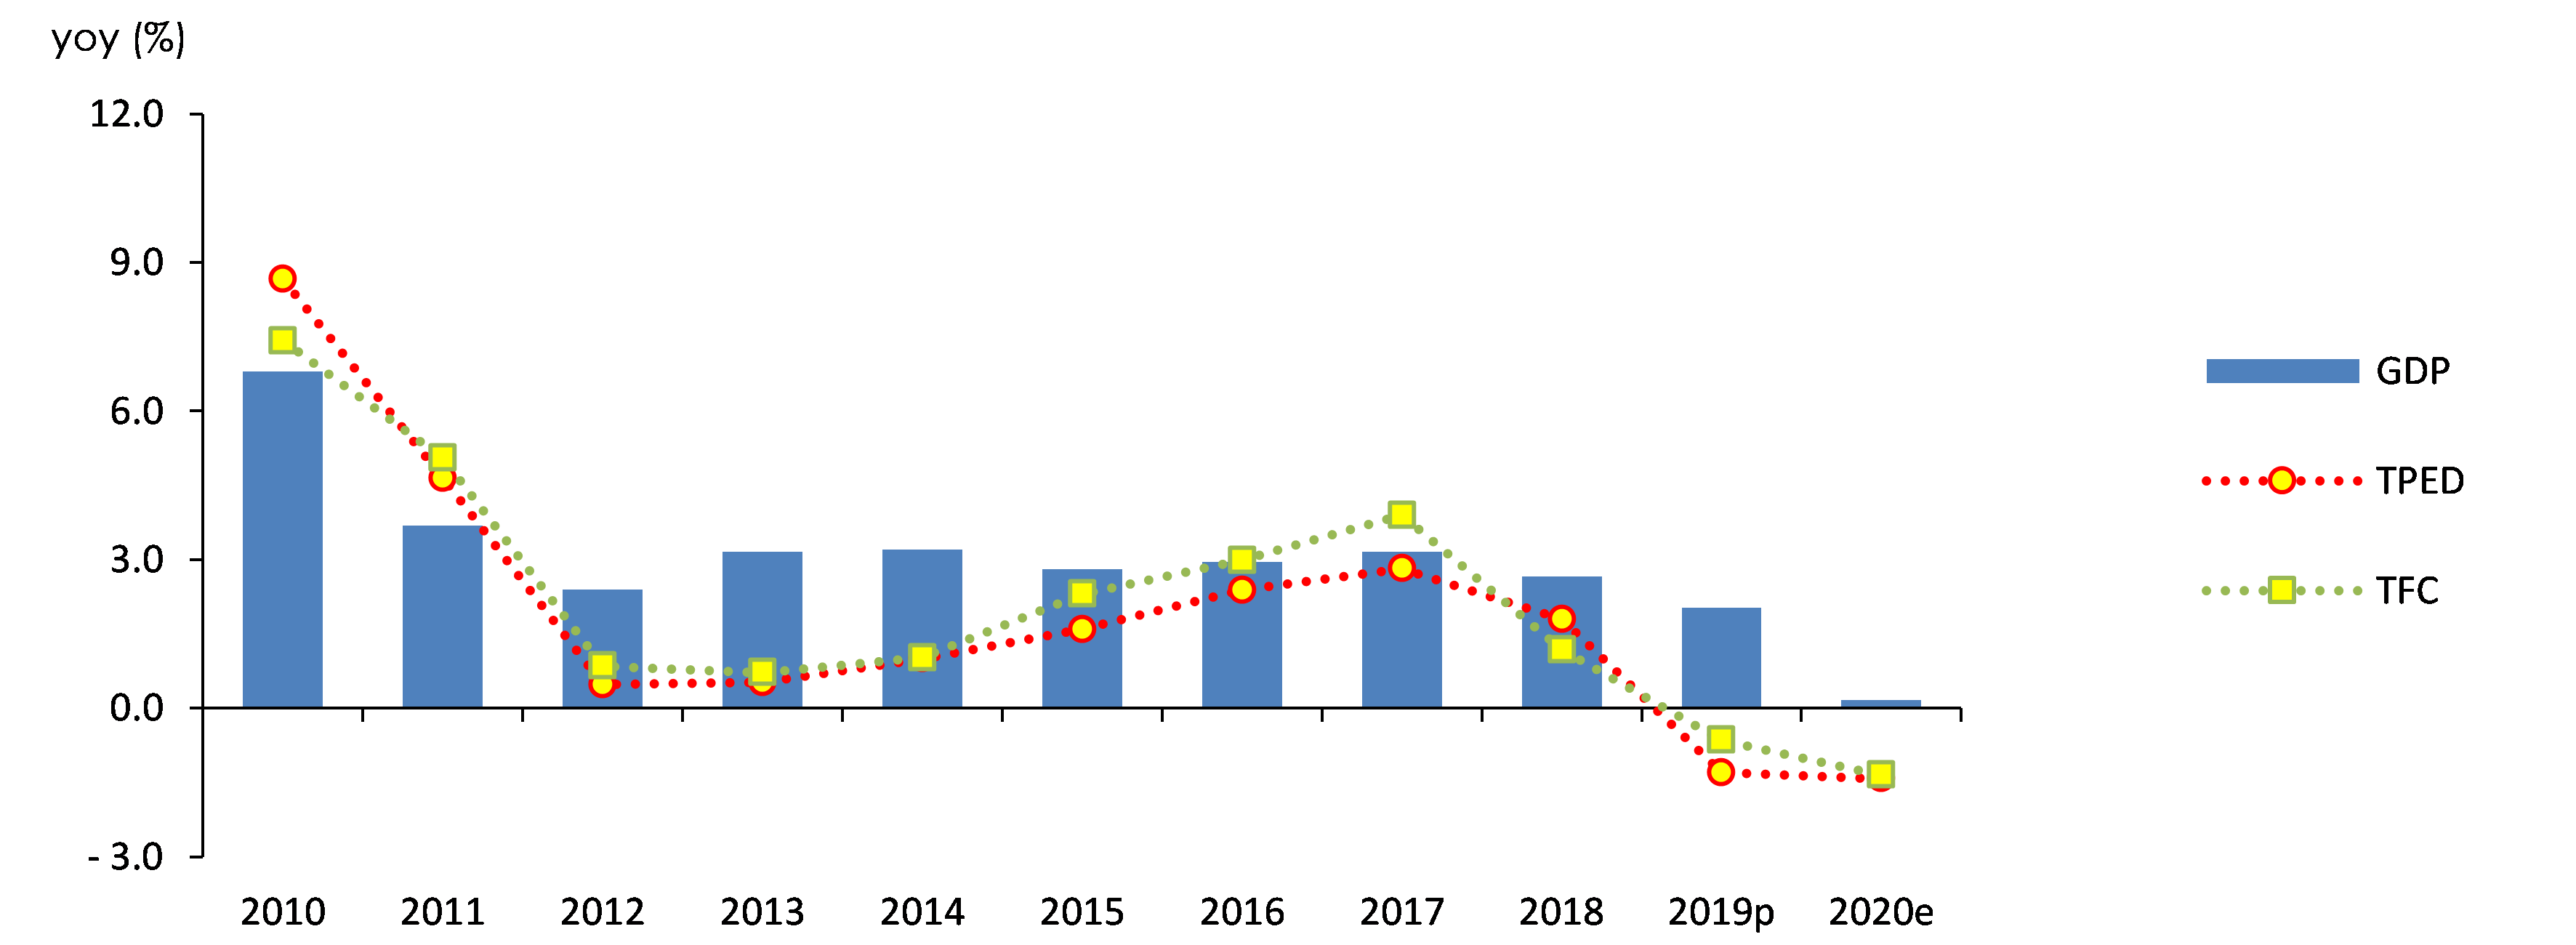
Coal and petroleum demand are forecast to decrease (in 2020) while nuclear and gas demand are likely to increase.
Petroleum demand is expected to drop by 1.0% in 2020 from the previous year, mostly in the transport sector, as overall traffic volume falls dramarically due to the social distancing measures that are adopted as a response to the spreading COVID-19.
Coal demand is forecast to drop by 7.7% year-on-year in 2020, with the power generation sector posting a double digit decline, although the demand falls just slightly in the end-use sectors.
Nucelar generation is likely to record a 12.2% year-on-year growth in 2020, considering the commissioning of a new reactor and recent growth in capacity factors at nuclear power plants.
Natural gas demand is expected to increase by 1.0% year-on-year in 2020, with the power generation sector leading the growth, although demand for city gas is likely to drop.
Electricity demand is forecast to be down 0.6% year-on-year in 2020, despite a growth in its residential demand, as it declines in industrial and commercial sectors, which account for a much large share of the total consumption.
Renewable enegy demand is forecast to drop by 0.1% year-on-year in 2020, as it declines in the power generation sector partly due to a change in the renewable category, although the demand growth is expected to come from the end-use sectors.
The growth rate of TPES & contributions by sources
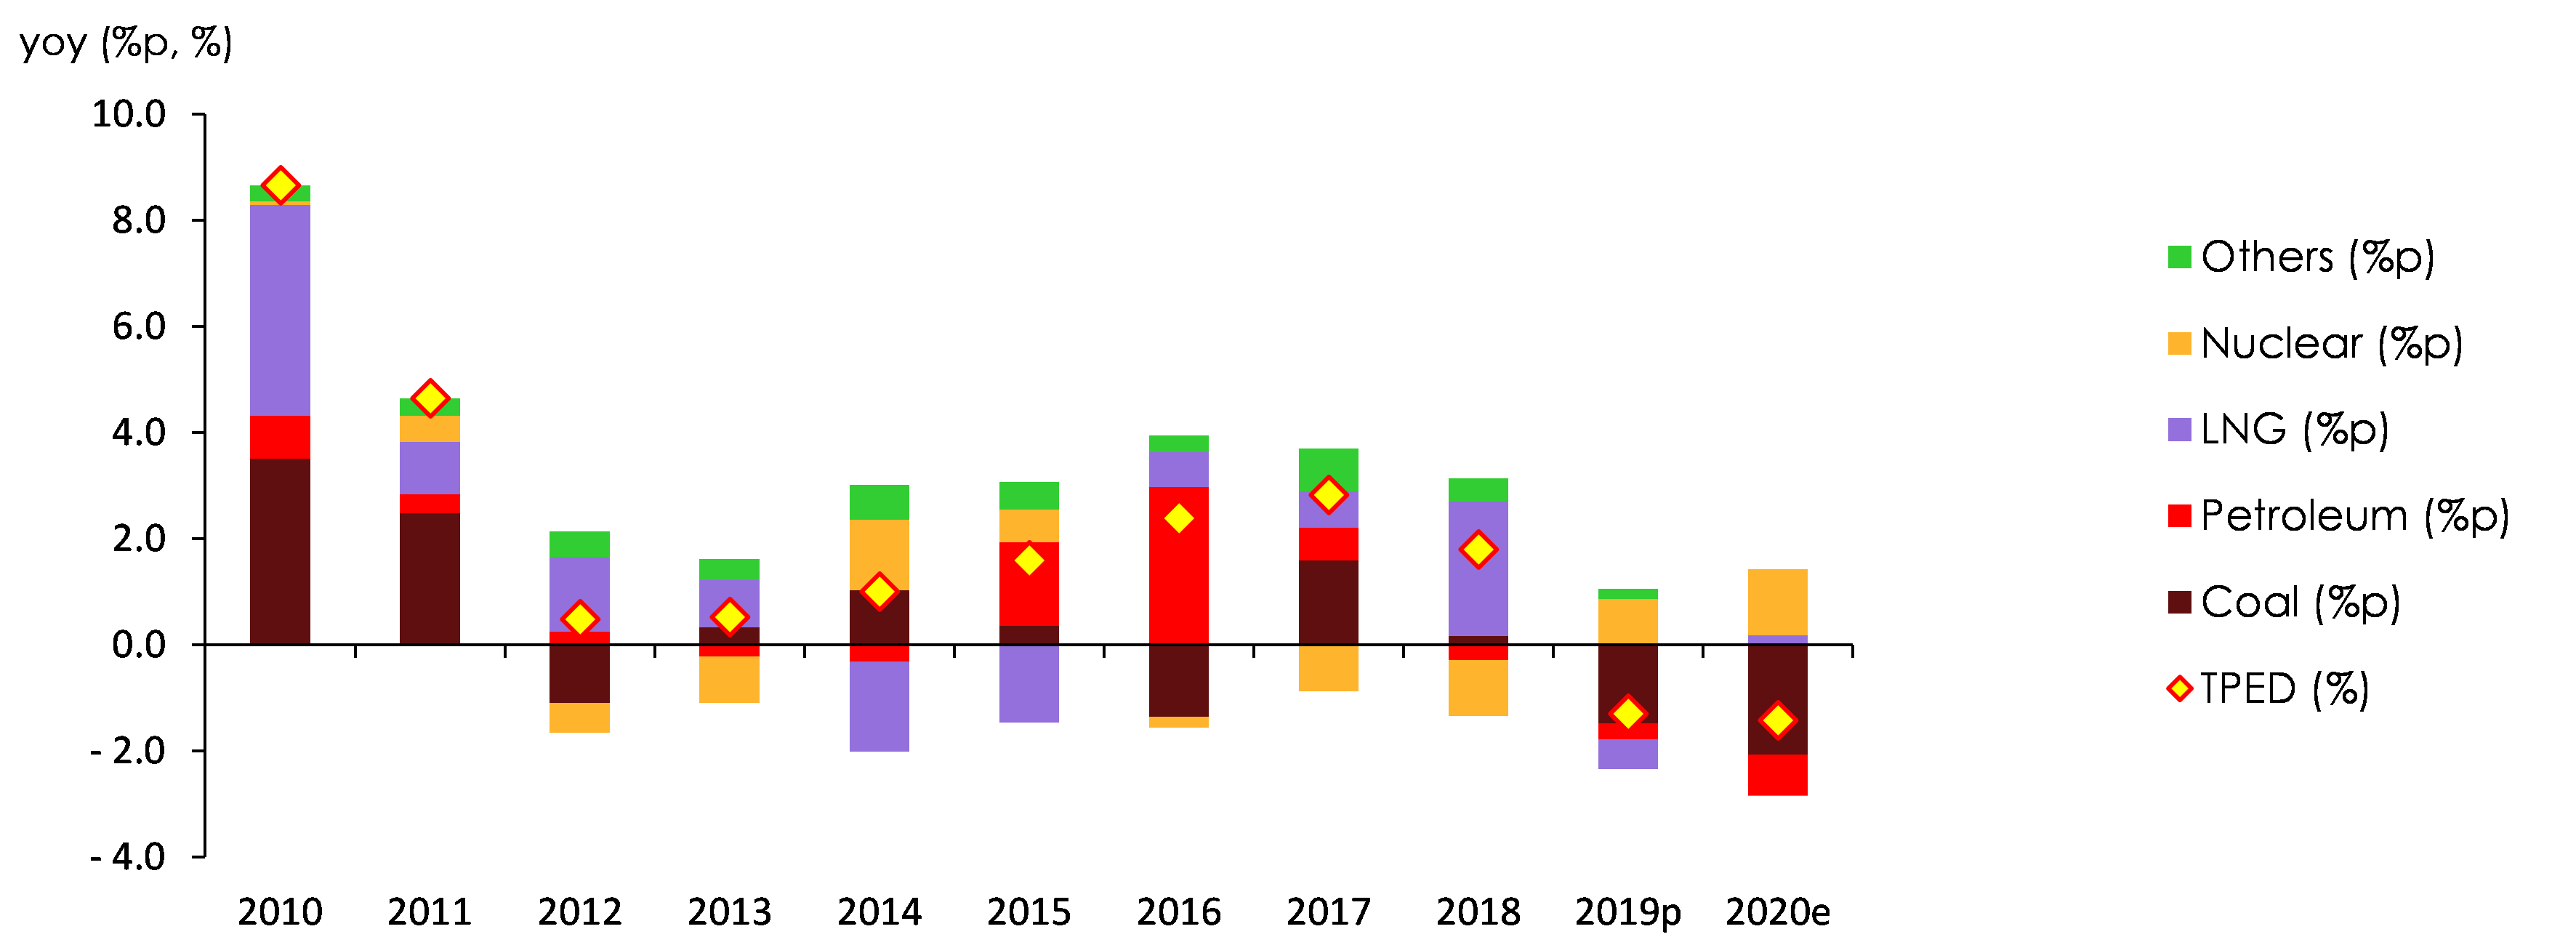
TFC is forecast to decrease in all the end-use sectors in 2020.
Industrial energy demand is expected to drop by 0.1% year-on-year in 2020; the demand is likely to drop faster (-1.0%) in 1H with the largest impact of COVID-19, and then drop more slowly (-0.8%) in 2H, showing sings of recovery.
The change and growth rate of TFC by energy sources and end-use sectors, 2020

Transport energy demand is expected to drop by 5.7% year-on-year in 2020, led by a sharp decline in the road transport and aviation sectors.
Buildings’ energy demand is likely to fall by 1.2% year-on-year in 2020, mostly in commercial buildings hit hardest by COVID-19, while the number of heating degreedays remained flat.
Key Features and Implications
The global COVID-19 pandemic and more frequent extreme heat events are causing a lot more uncentainties in our energy demand outlook.
The COVID-19 pandemic is the biggest factor that affects our energy demand outlook in this report, and the outlook will continue to be largey affected by the extent and duration of the COVID-19 spread.
Another factor that aggravates uncertainty in energy demand outlook is more frequent extreme weather events such as heat waves.
To cope with such uncertainty, this report suggests economic growth scenarios, depending on the extent and duration of the COVID-19 pandemic, and additionaly summer heat wave scenario.
The COVID-19 crisis and economic growth scenarios
The spread of COVID-19 at home and aborad is causing unprecedented uncertainties in domestic and global economies, and thus requires analysis.
The global economic growth will be much slower in 1H 2020, as economic activities slump amid the nationwide lockdown and border blockade in many countires. COVID-19 suppression measures and their outcome will be different country by country, and therefore the economy will slowly recover in 2H 2020.
COVID-19 is bringing changes in people’s ways of life and behaviors, and it is likely to affect the pace of the economic recovery and the recovery pattern in different businesses & sectors as well as the energy consumption and its structure.
There remains uncertainty regarding the future of the global economy, depending on the extent and duration of the COVID-19 pandemic.
KDI released economic scenarios (May 2020) to explore how the global economy might be affected by the extent and duration of the COVID-19 pandemic.
(Base scenario) The spread of COVID-19 slows down at home (1H) and abroad (2H) and then the situation gradually improves. Domestic economic activities slowly resume from May while that of the global economy restart from 2H along with growth in long-delayed investment.
(High growth scenario) This scenario expects the global COVID-19 pandemic might be rapidly mitigated, and most countries see the situation return to normal in 2021 as it was before the pandemic. As COVID-19 cases are controlled at very low level and a treatment or vaccine becomes available, domestic economic activities pick up from May 2020, and the global economic activities see a visible recovery from 3Q 2020.
(Low growth scenario) There are second and third waves of COVID-19 outbreak in countries where the crisis is well-stablized or still severe, and therefore the number of new cases are high. Economic activities decline with deteriorating sentiment due to infection risk, and economic policies are not quite helpful in coping with the crisis, and private consumption and investment plunges globally.
Economic growth scenarios
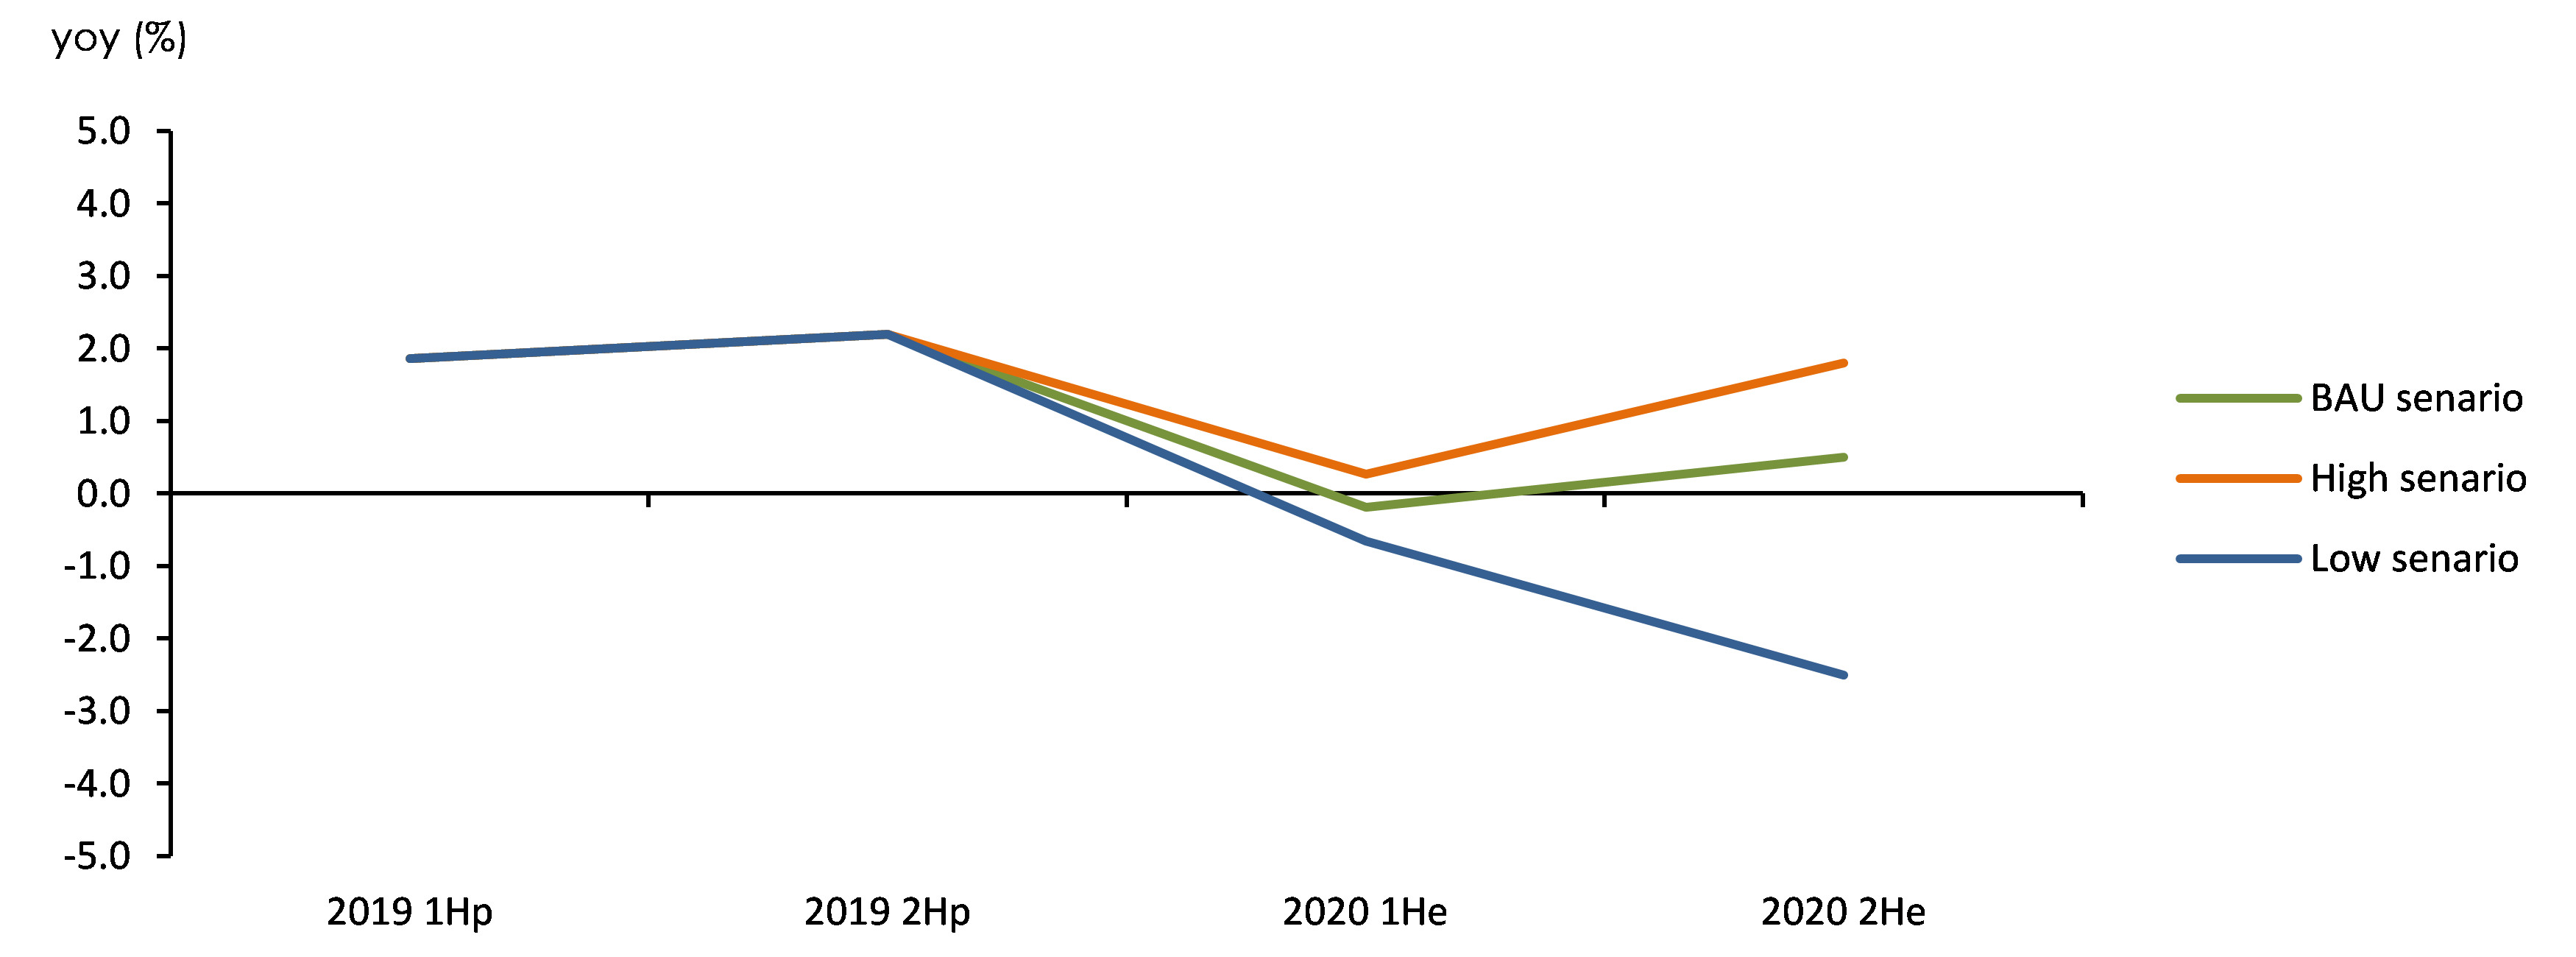
The economic scenarios below suggest the negative impact of COVID-19 on the industry.
In low growth scenario, industrial and transport energy demand drop by 1.2% and 1.5% respectively compared to base scenario due to COVID-19, while the buildings sector is slightly less affected, posting a 0.9% drop in energy demand.
In high growth scenario, energy use declines more slowly in the buildings and transport sectors and increase in the industrial sector compared to base scenario, as the domestic and global economies fast recover from the COVID-19 crisis.
The growth rate of TPES by scenarios

Heat wave scenario
Heat waves have been occuring more frequently amid a visible upward trend in summer temperatures and the number of cooling degree days.
The number of cooling degree days surged by 87.2% year-on-year during the summer of 2016, and the total and buildings’ power use were up 5.9% and 9.6% respectively in August when the weather was the most sweltering.
2018’s heat wave was recorded as the most extreme heat event since the national weather forecast started. In that year, the number of cooling degree days rose by 57.5% year-on-year and 35.6% compared to 2016.
Considering that Korea Meteorological Administration (KAM) expects another swelthering summer for 2020 (May 2020), an analysis is required on how the extreme heat event might affect electricity demand.
Assuming that the number of cooling degree days is the same as 2018, the growth rate of electricity demand increases by 0.6%p from base scenario.
Heat wave scenario assumes the number of cooling degree days in 2020 is the same as 2018 (209.0) when the weather was the hottest since national weather forecast started, and in this case, the number of cooling degree days increases by 73.6% from the previous year.
Heat wave scenario shows the largest change in the residential sector compared to base scenario; electricity demand grows by 5.5% annually and by 11.1% in 3Q that includes the summer season.
If COVID-19 coincides with heat waves, the impact of COVID-19 may partially offset that of heat waves in the commercial sector unlike the residential sector, even though both sectors refer to buildings.
Industrial electricity demand is likely to be least affected by temperature changes; the growth rate of electricity demand is forecast to increase by mere 0.2%p from base scenario.
[1] IMO decided to ban ships from using fuel oil with a sulfur content above 0.5% from 2020. The previous limit was 3.5%.
Attachments-
_에너지수요전망_2020H1_표지1.png
Download
-
KoreaEnergyOutlook_2020_FirstHalf.pdf
Download
View Details