
Korea Mid-term Energy Outlook
Research • Publications
-
Korea Mid-term Energy Outlook (2023-2028)
- Date2024/08/30
- Author Department of Energy Supply Statistics Research
- Number of downloads 23
-
Download multiple files Download the entire file
Total Primary Energy Demand and Total Final Consumption
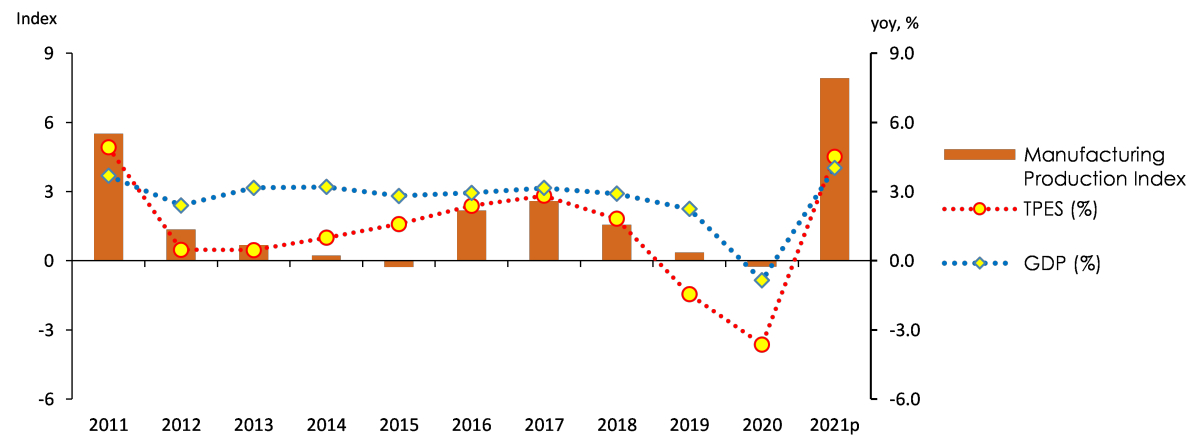
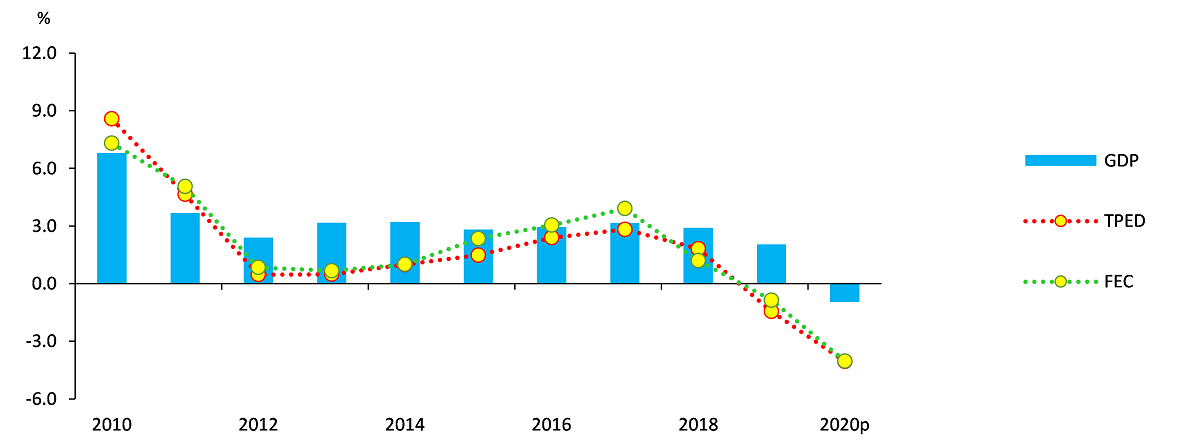
Total Primary Energy Demand (TPED) is expected to decline by 0.3% per year on average from 2018 to 2023 due to COVID-19, global economic slowdown, etc.
TPED grew rapidly by more than 5% in 2021 due to the recovery from COVID-19, but then slowed to a decline in 2023 due to the global economic slowdown.
Trend in TPED & GDP growth rates and Manufacturing Production Index
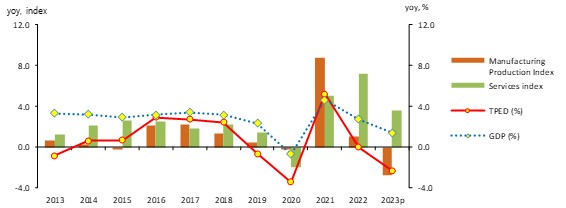
Energy intensity (toe/million) improves (declines) rapidly over the 2022-2023 period, with TPED declining more rapidly than economic growth.
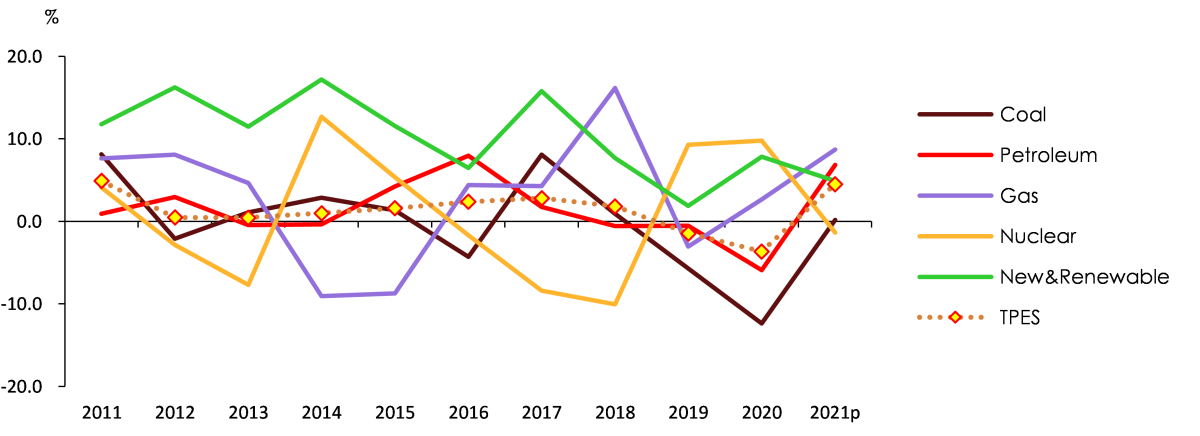
Annual growth rates by energy source in 2010-2018 and 2018- 2023
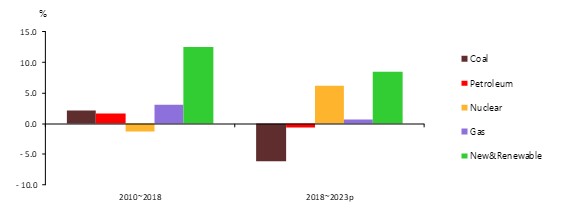
Nuclear, renewables, and gas consumption have increased over the past five years (2018-2023), while coal has declined significantly.
Coal consumption peaked in 2018 and declined rapidly over the last five years at an average annual rate of 6.2%, with declines in both power generation and industrial use.
Oil consumption declined by 0.7% CAGR from 2018 to 2023, despite large-scale petrochemical capacity additions in 2021 and 2022, due to the continued rise in China's petrochemical self-sufficiency rate, COVID-19, etc.
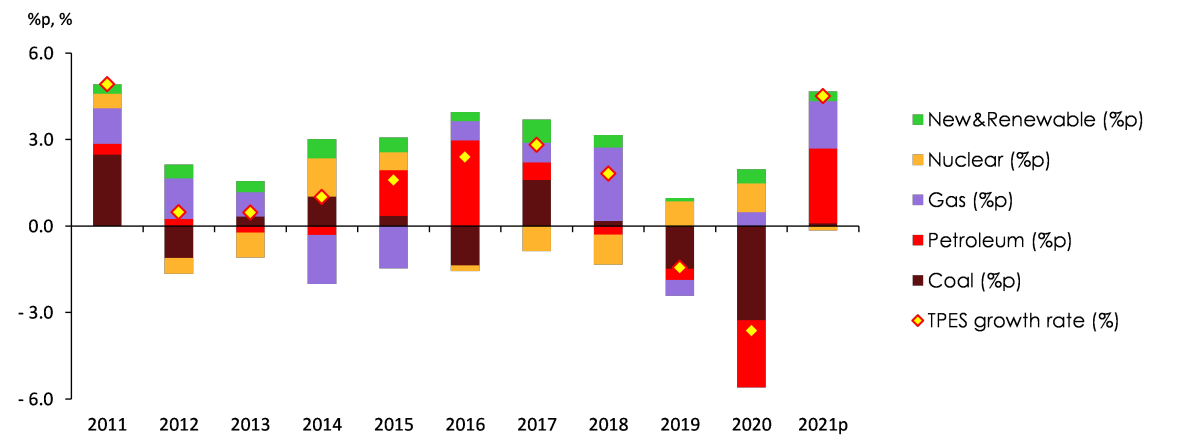
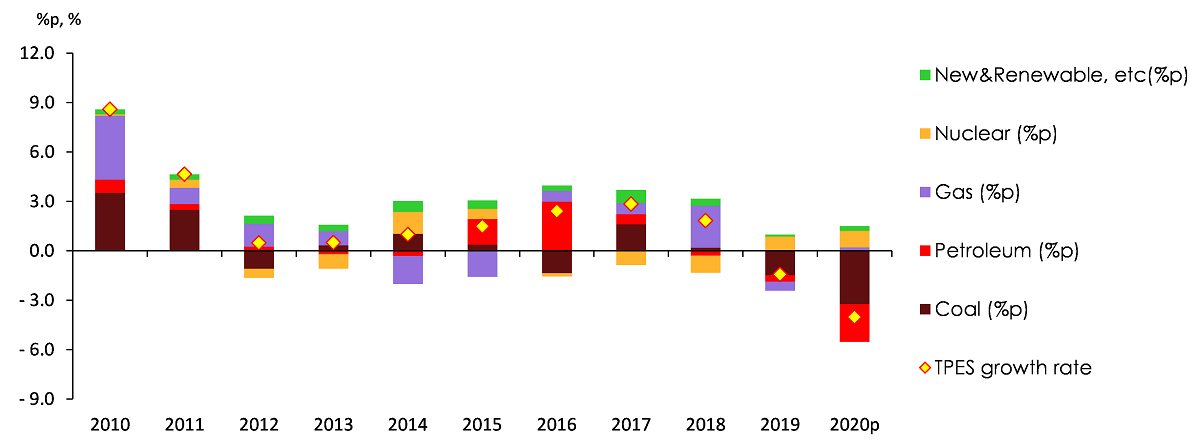
Contribution by energy source to fluctuation of TPED
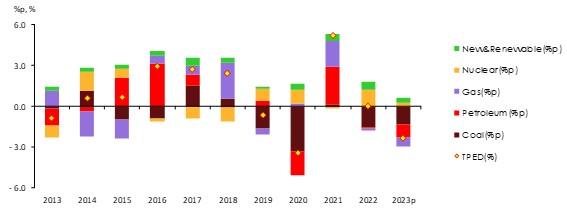
Gas (natural gas + city gas) consumption has slowed to an average annual growth rate of 0.7% over the last five years (2018-2023), with power generation and industrial use increasing, but building use decreasing.
Nuclear power generation increased at an average annual rate of 6.2% from 2018 to 2023, driven by the entry of new nuclear power plants and increased capacity utilization.
Consumption of renewable and other energy grew at an average annual rate of 8.5%, mainly in the power generation sector, thanks to the government's policy to expand its use.
Electricity consumption increased at an average annual rate of 0.8% between 2018 and 2023, with recent volatility due to extreme weather events and COVID-19.
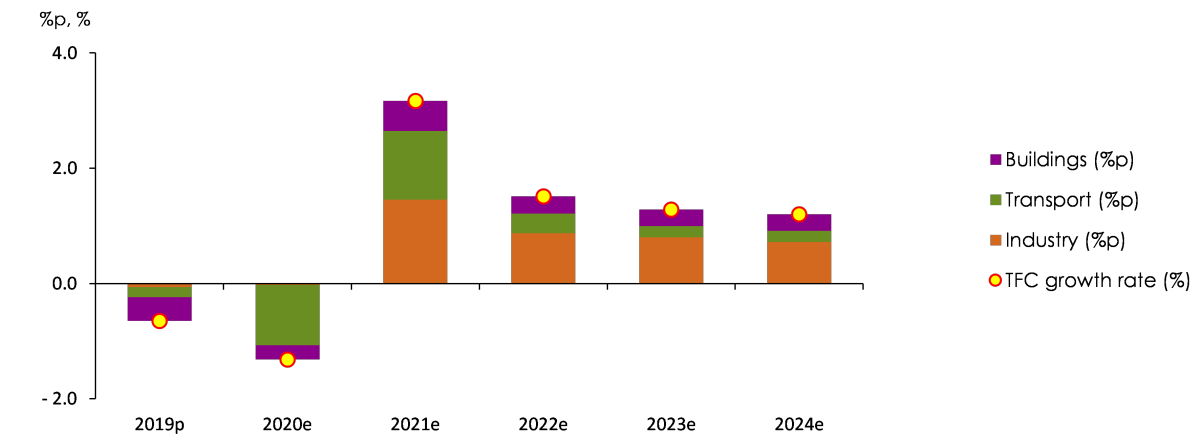
Contribution by energy source to fluctuation of TFC
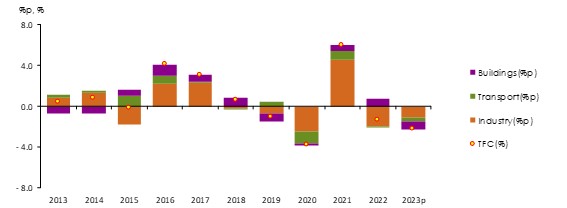
Total Final Consumption (TFC) will decrease at a CAGR of 0.5% from 214.4 million toe in 2018 to 208.6 million toe in 2023.
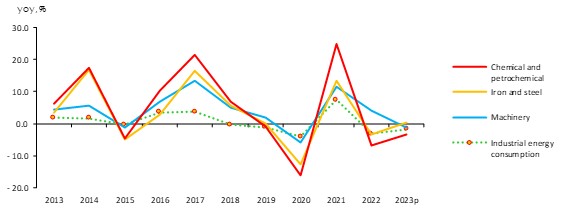
Industrial sector energy consumption will decline by 0.6% over the 2018-2023 period, with year-on-year declines in every year since 2018 except 2021, when it grew rapidly due to recovery from COVID-19.
Trend of growth rate of energy consumption in industrial and energy-intensive industries
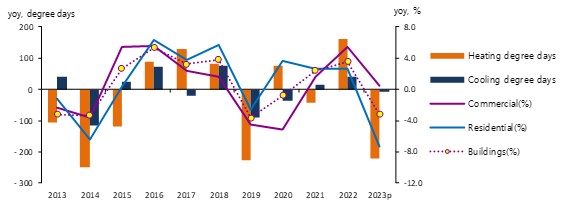
Energy consumption in the buildings sector, which fluctuates significantly with temperature, is expected to decline by 0.4% per year on average from 2018 to 2023, with a mixed shift between residential and commercial due to COVID-19.
Trends in heating and cooling degree-days and building energy consumption growth
Energy consumption in the transportation sector increased by more than 5% in 2021 due to the base effect, but it is expected to decrease by an average of 0.5% per year for the entire period from 2018 to 2023 due to factors such as rising oil prices, economic slowdown, and increased overseas travel.
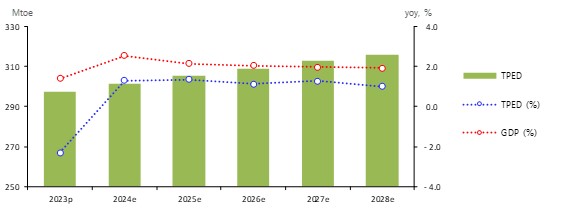
TPED & TFC Outlook
TPED is projected to grow at an average annual rate of 1.2% over the 2023-2028 period, reaching 315.9 million toe.
TPED will decline in 2023 as a result of slowing economic growth, then rebound in 2024 with the economic recovery and grow modestly in the mid-1% range thereafter.
Trend in GDP & TPED growth rates
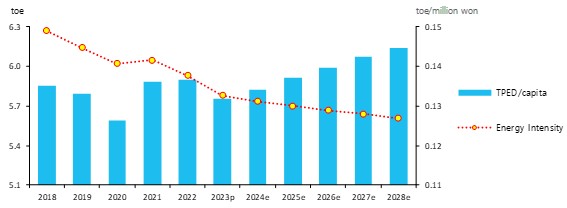
Energy intensity is expected to continue to improve at an average annual rate of 1% during the outlook period.
Energy intensity (toe/million KRW) has been improving at a faster pace in the last five years due to the impact of COVID-19 and steel plant shutdowns caused by typhoon damage, but is expected to improve moderately at the 1% level in the outlook period due to the recovery in energy demand.
TPED per capita and energy intensity outlook
Consumption of all energy sources except coal will increase over the outlook period, with gas experiencing the largest increases.
Coal demand will increase slightly in the industrial sector, but decline rapidly in the power generation sector, falling by an average of 1.5 percent per year over the outlook period, except in 2027.
Oil demand will grow in both the industrial and transportation sectors, but at an average annual growth rate of only 0.7% due to sluggish demand from the domestic petrochemical industry, driven by structural factors such as a changing export environment and increased global competition.
Energy demand growth rates by energy source
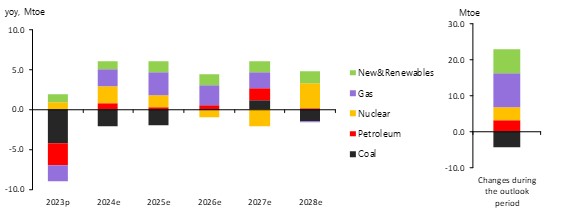
Gas (natural gas + city gas) demand is expected to increase at a CAGR of 3.1% over the forecast period, driven by growth in both power generation and final consumption, driving TPED growth.
Nuclear power generation is expected to grow at an average annual rate of 1.8% due to the entry of two new nuclear power plants. However, the growth in power generation is expected to be limited due to the continued maintenance of a number of old nuclear power plants and the lack of transmission lines in the metropolitan area.
Renewable and other energy demand will be the fastest growing, growing at a compound annual growth rate of 6.6% over the forecast period, but growth will be slower than in the past due to a slowdown in investment in solar power generation due to rising financing costs.
Electricity demand is expected to grow at an average annual rate of 1.5%, driven by growth in both the industrial and building sectors.
Energy demand growth rates forecast by end-use sector

TFC is projected to grow at an average annual rate of 1.0% over the outlook period, reaching 219.2 million toe in 2028.
TFC is expected to rebound in 2024 due to base effects in all sectors, including industry, buildings, and transportation, and resume growth in 2025, led by a recovery in energy-intensive sectors.
Energy demand from the industrial sector is expected to rebound in 2024, followed by modest growth before accelerating in 2027, growing at an average annual rate of 0.9 percent over the forecast period.
Contribution by energy source to fluctuation of industrial energy use
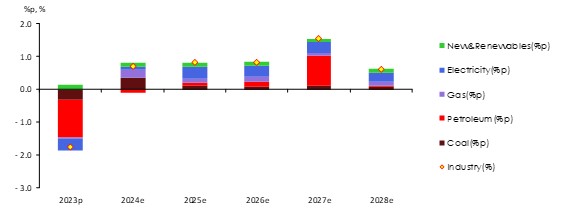
Demand in the transportation sector is expected to grow at an average annual rate of only 0.6% due to stagnant growth in international travel, a declining and aging population, and downwardly stabilizing economic growth.
Energy demand in the building sector is expected to grow at an average annual rate of only 1.5% over the forecast period, as rising electricity and gas prices dampen consumer sentiment and the recovery in food and accommodation and wholesale and retail is slow.
Key Features and Implications
Transmission line constraints and changing outlook for power generation
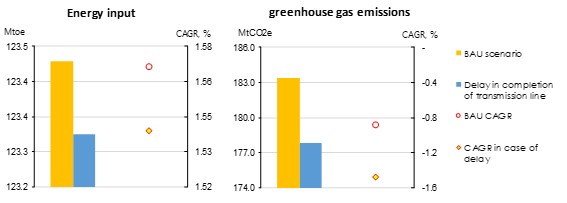
Uncertainty exists in the outlook for coal and gas power generation and energy input demand depending on the timing of transmission line completion.
If the East Coast to Metropolitan Area Transmission Line is completed by 2026 as planned by the government, the shortage of transmission lines in the metropolitan area will be greatly alleviated, but there is uncertainty about the timing of completion due to unforeseen challenges such as resident acceptance.
Assuming that the shortage of transmission lines in the metropolitan area will begin to ease in 2027, coal and gas generation is expected to decline by 3.1% and increase by 3.7% per year on average over the forecast period (2023-2028), respectively.
If the East Coast to Metropolitan Transmission Line is not completed by 2028, the decline in coal generation is expected to be even deeper than in the base case, and gas generation is expected to increase significantly and become the number one source of electricity generation.
Power sector input energy and GHGs in 2028 under transmission line uncertainty
Expanding into the petrochemical industry in Middle Eastern oil producing countries
Middle East's expansion into petrochemicals is likely to limit South Korea's petrochemical energy demand growth in the medium to long term.
Amidst the global energy transition, Middle East oil producers are looking to expand their petrochemical industry presence.
The leading COTC project in the Middle East is the Ras al-Khair project, a joint venture between Saudi Aramco and Saudi Basic Industries Corporation (SABIC) to build a 3 million tons per day ethylene COTC facility with an investment of approximately $20 billion.
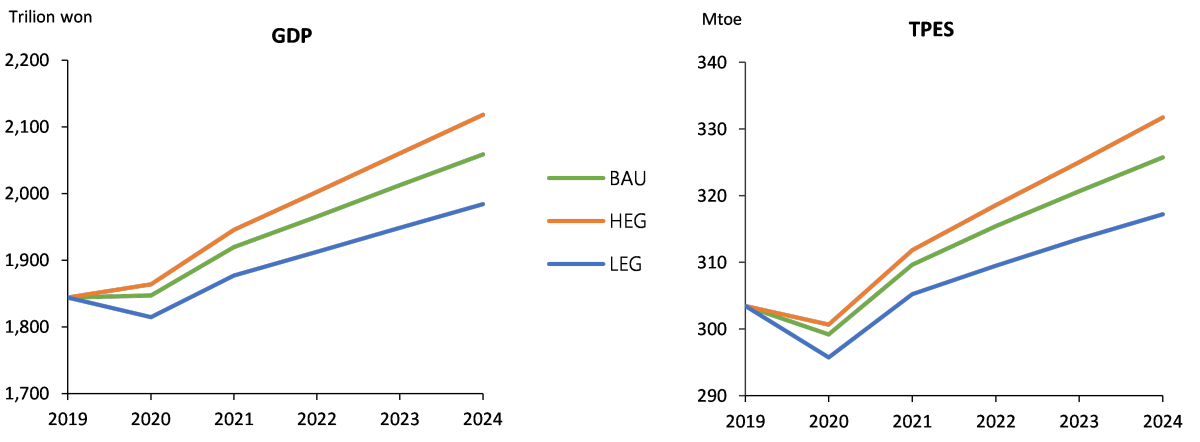
Economic growth scenarios
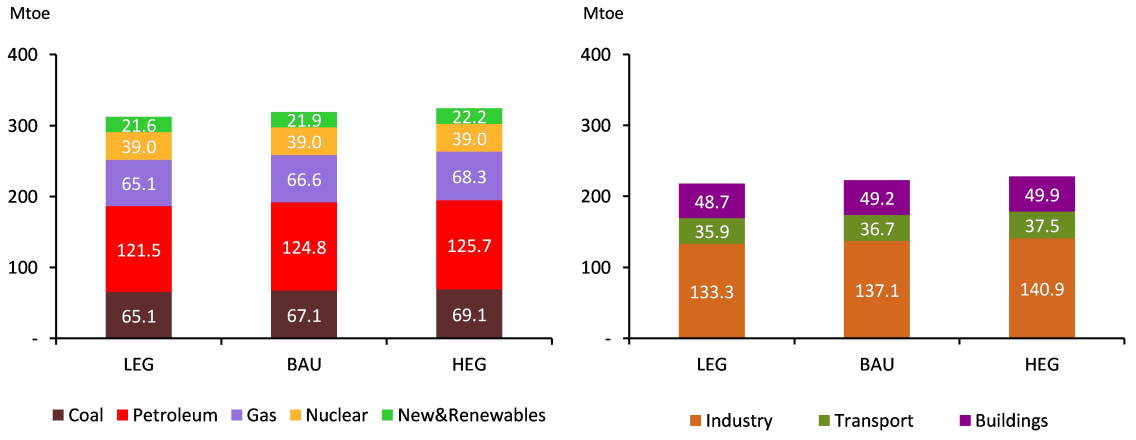
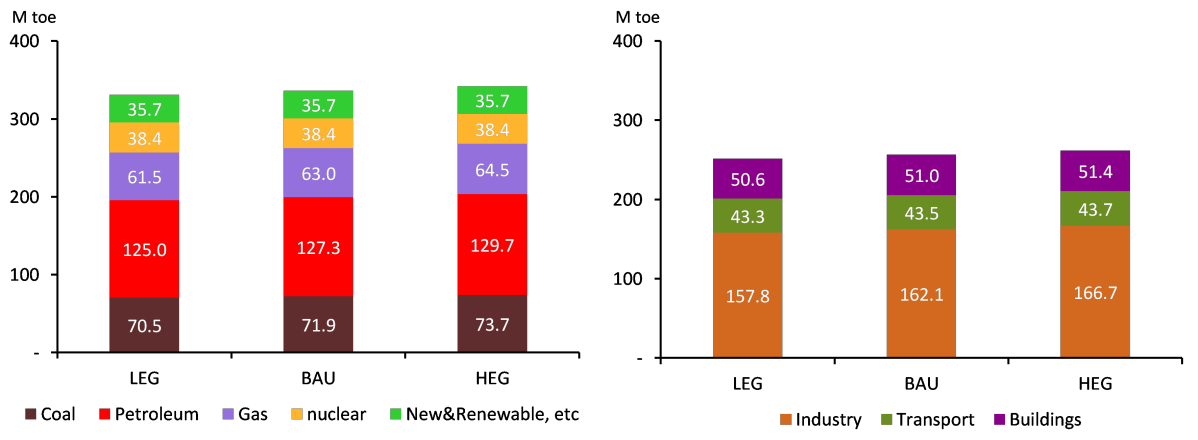
TPED increases by 1.5% CAGR over the forecast period in the high economic growth (HEG) and 1.0% CAGR in the low economic growth (LEG).
The HEG and LEG scenarios were developed considering economic uncertainties during the outlook period (2023-2028).
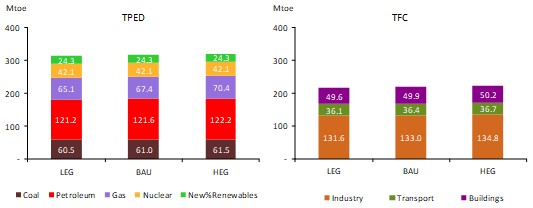
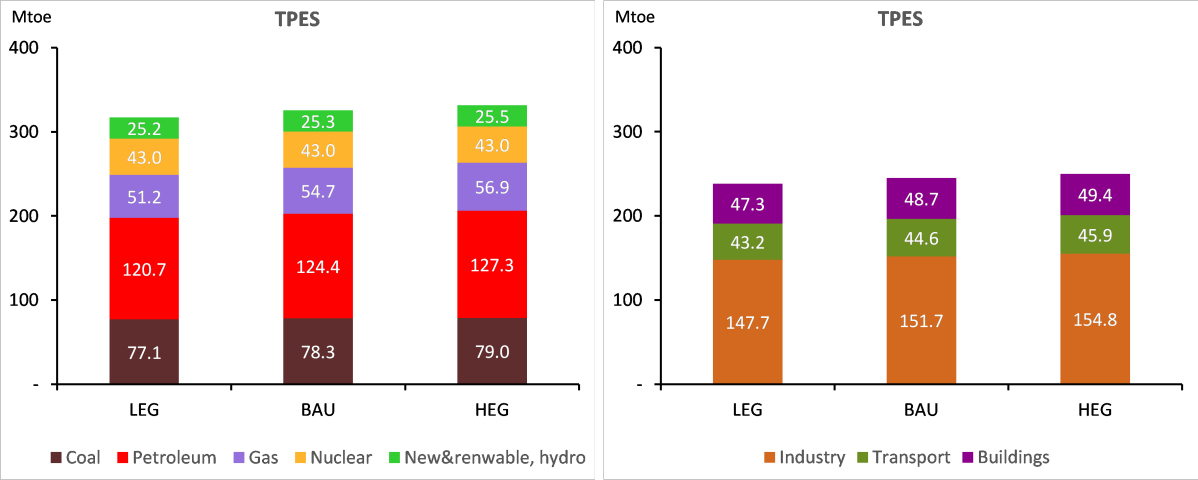
TPED and TFC outlook across three scenarios
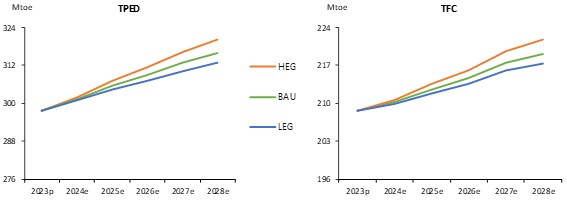
TPED is projected to grow at an average annual rate of 1.4% over the outlook period (2023-2028) in the HEG scenario, reaching 3.2 million toe in 2028, and at an average annual rate of 1.0% in the LEG scenario, remaining at 3.13 million toe.
TPED & TFC outlook in 2028 across three scenarios
 Attachments
-
 N_중기(2024).jpg
Download
N_중기(2024).jpg
Download
-
 _Midterm_Energy_Outlook(2023~2028).pdf
Download
View Details
_Midterm_Energy_Outlook(2023~2028).pdf
Download
View Details
-
Korea Mid-term Energy Demand Outlook (2022-2027)
- Date2023/11/13
- Author Department of Energy Outlook Research
- Number of downloads 21
-
Download multiple files Download the entire file
Total Primary Energy Demand and Total Final Consumption
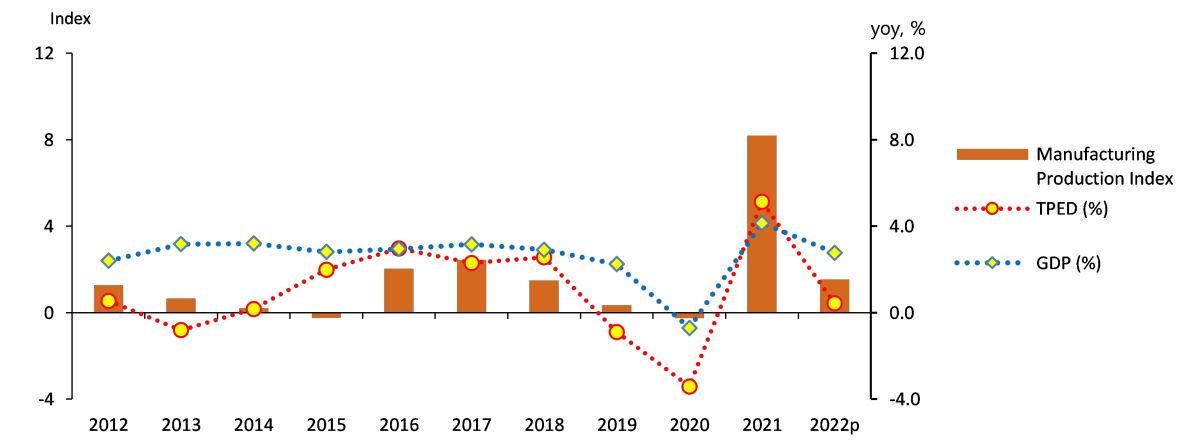
Total Primary Energy Demand (TPED) increased by 0.7% on annual average between 2017 and 2022, reaching 304.5 Mtoe.
In recent years, TPED fluctuated in a wider range, falling sharply and then bouncing back, which was affected by stagnant production activities during the COVID-19 pandemic and the following recovery.
Trend in TPED & GDP growth rates and Manufacturing Production Index
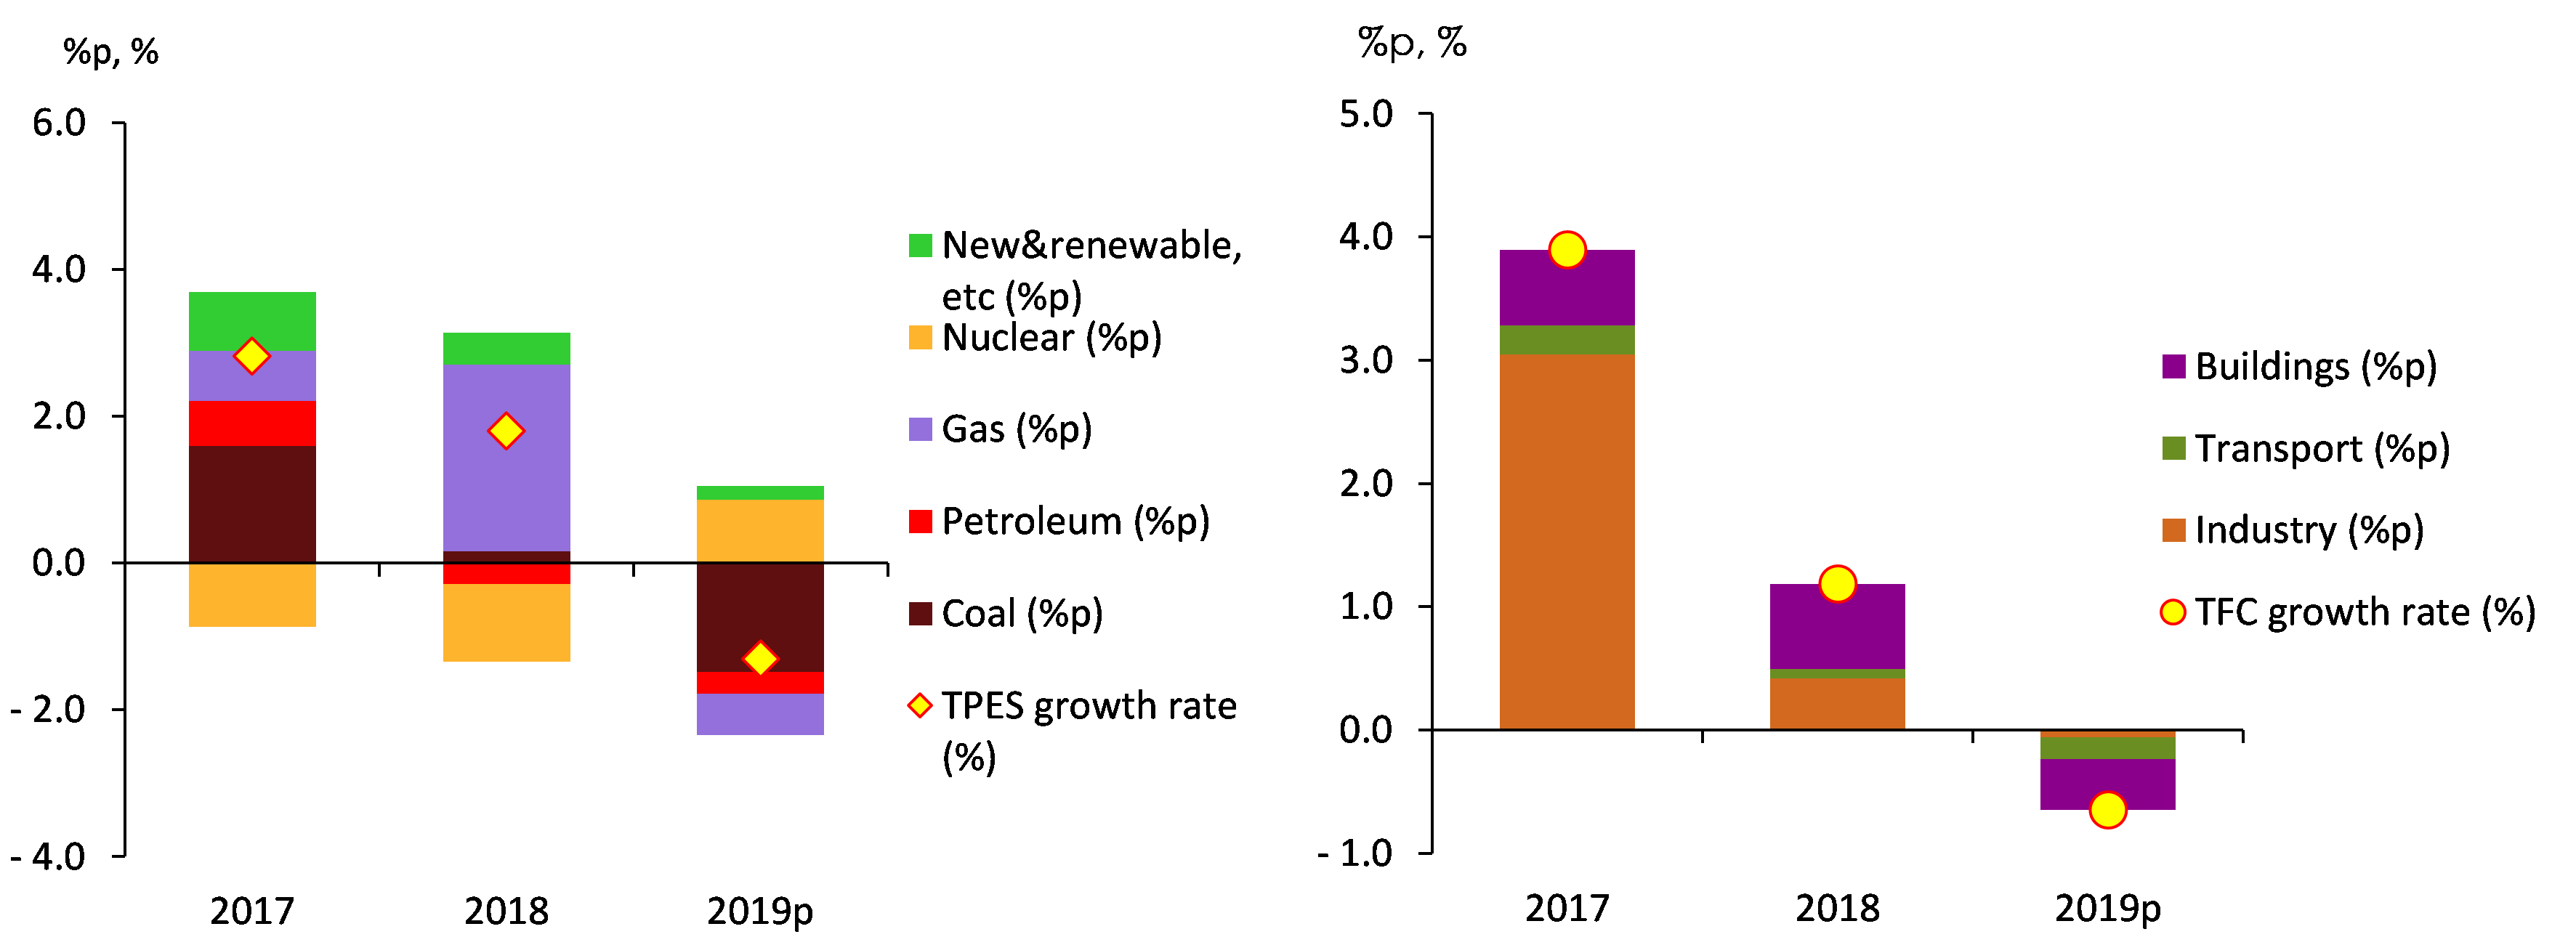
Annual growth rates by energy source in 2007-2017 and 2017- 2022
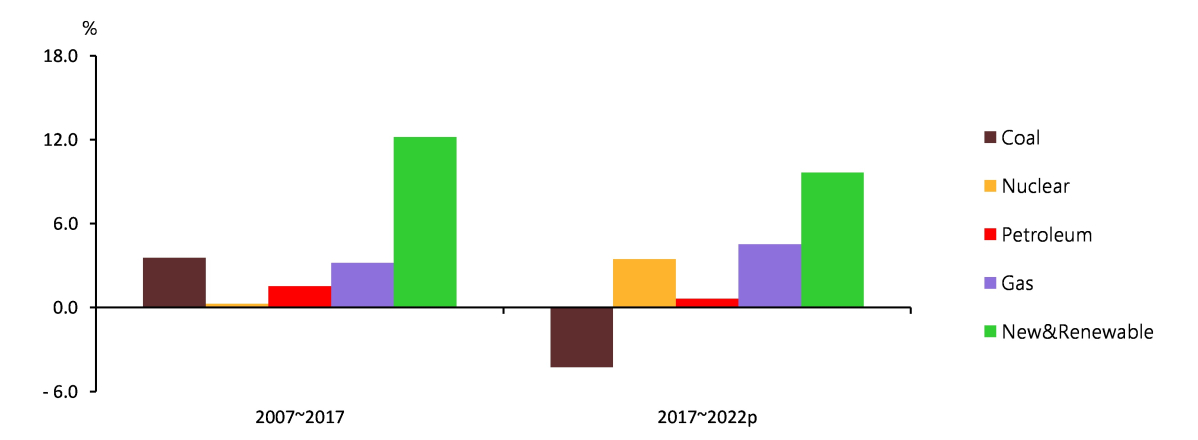
During the recent five-year period, the use of nuclear energy, gas and renewable energy grew fast, while coal use decreased, and petroleum use remained stagnant.
Coal use had rapidly increased until the early 2010s, led by the power generation and steelmaking sectors. Between 2017 and 2022, however, it fell sharply by an annual average rate of 4.4% due to sluggish iron & steel business and the government's restrictions on coal-fired power plants.
Petroleum use fluctuated between 2017 and 2022, as energy demand dropped during the COVID-19 spread and then recovered. In 2022, it remained at the level of 2017, at around 814.5 Mbbl.
Contribution by energy source to fluctuation of TPED
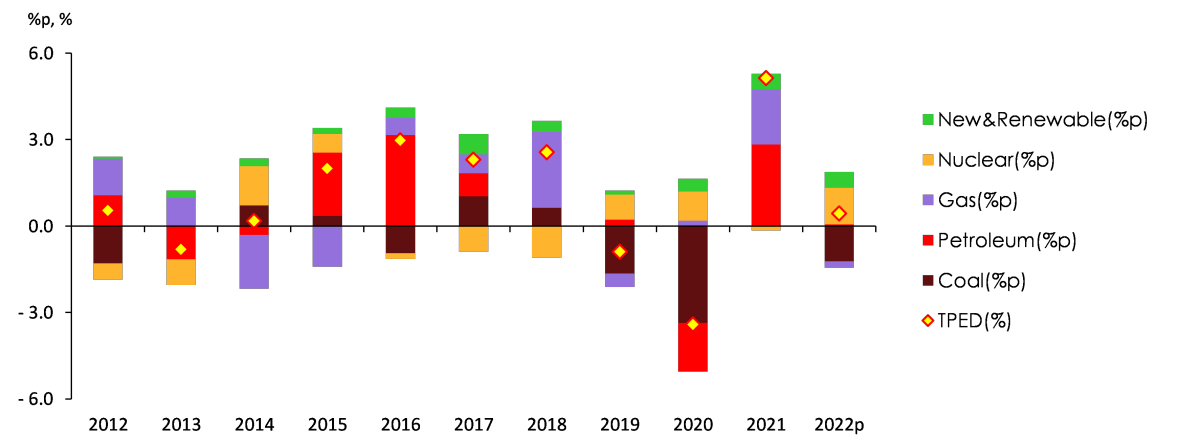
Nuclear generation has increased by 3.5% on annual average between 2017 and 2022, as its installed capacity increased with the commissioning of a large-scale nuclear reactor. Renewable & other energy use has increased at an annual average rate of 9.6%, mostly in the power generation sector, based on the government's renewable energy deployment policy.
Installed capacity by renewable & other energy source
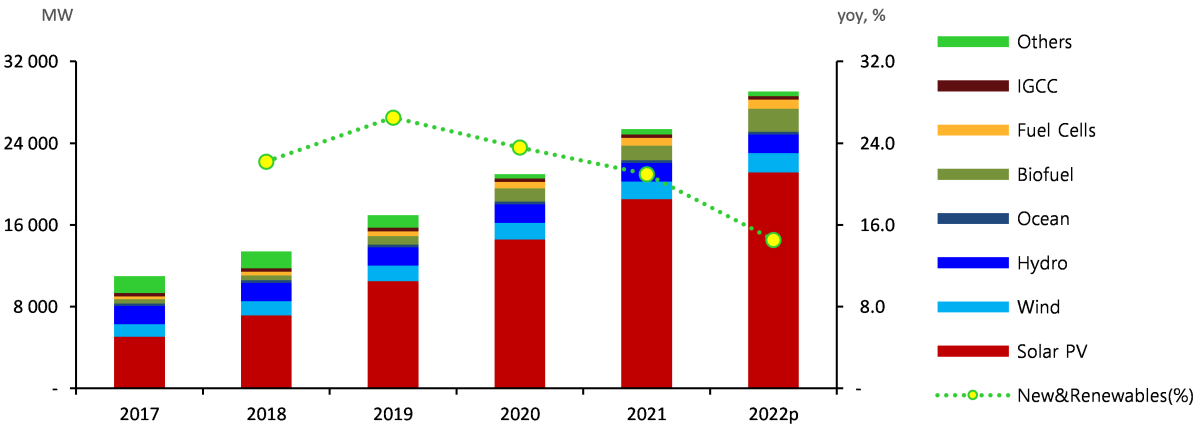
Note: The installed capacity of each renewable & other energy source is based on the data from Korea Electric Power Corporation (KEPCO)'s 'The Monthly Report on Electric Power Statistics'. By-product gas and waste energy are included in the 'Others' category.
Natural gas use has grown at an annual average rate of 4.5% between 2017 and 2022, as it grew fast in the power generation sector, partially offsetting a drop in coal-fired power generation, although the final use of natural gas remained rather stagnant.
Electricity use has been fluctuating more widely due to the recent abnormal weather conditions and the COVID-19 pandemic. It increased by 1.6% on annual average between 2017 and 2022.
Contribution by energy source to fluctuation of TFC
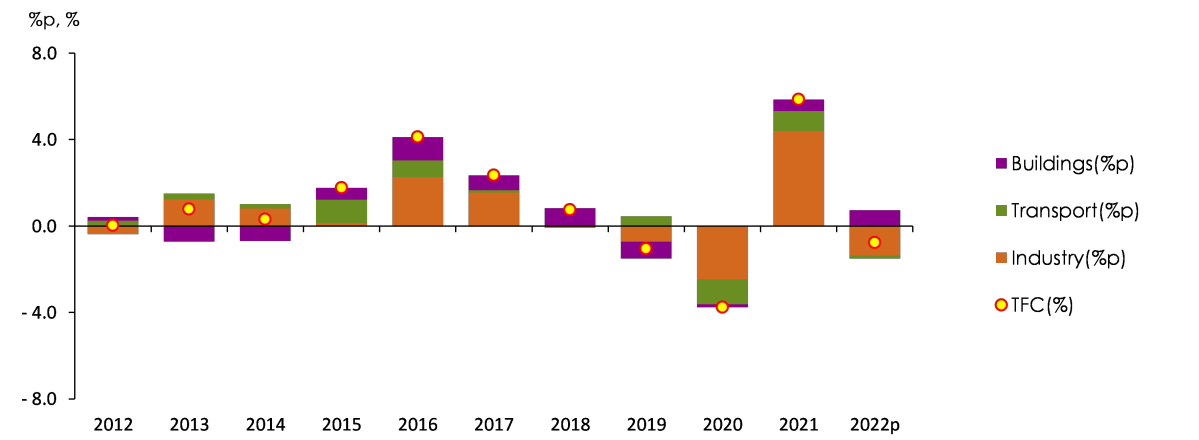
Total Final Consumption (TFC) was 212.4 Mtoe in 2017, and it increased by mere 0.1% on annual average between 2017 and 2022, reaching 214.0 Mtoe in 2022.
Industrial energy use recorded similar levels in 2017 (130.9 Mtoe) and in 2022 (130.0 Mtoe). Between 2017 and 2022, however, it fluctuated far more widely, partly affected by the COVID-19 pandemic.
Trend in cooling & heating degree days and growth rates in buildings' energy use
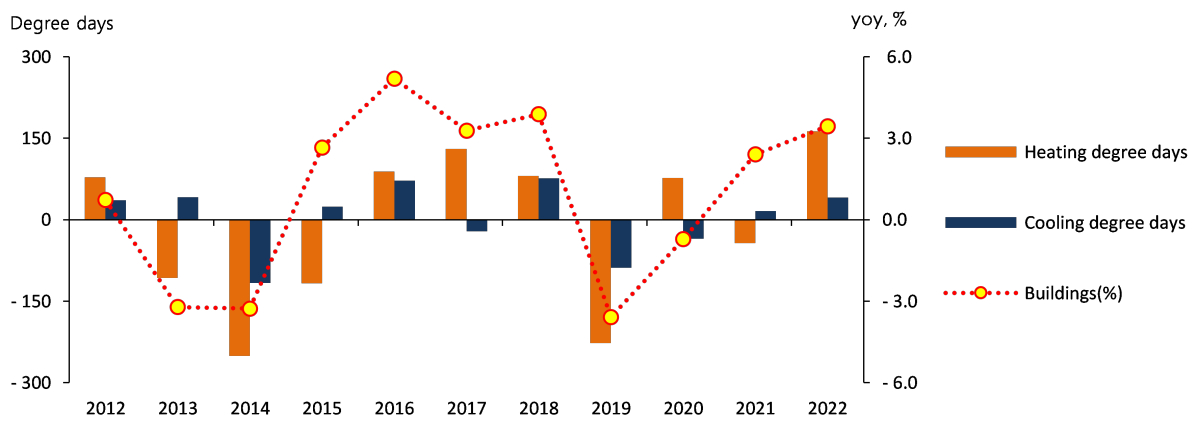
In the building sector, energy use has been growing at slower rates due to the stagnant population growth and improved energy efficiency, and it has increased at an annual average rate of 1.0% between 2017 and 2022 owing to abnormal weather conditions, and as cooling demand increased following the revision of progressive tax rates for residential power use.
In the transport sector, energy use fluctuated greatly in line with mobility demand that changed sharply depending on the implementation of social distancing rules during the COVID-19 spread. The growth rate in energy use was mere 0.1% on annual average between 2017 and 2022.
TPED & TFC Outlook[1]
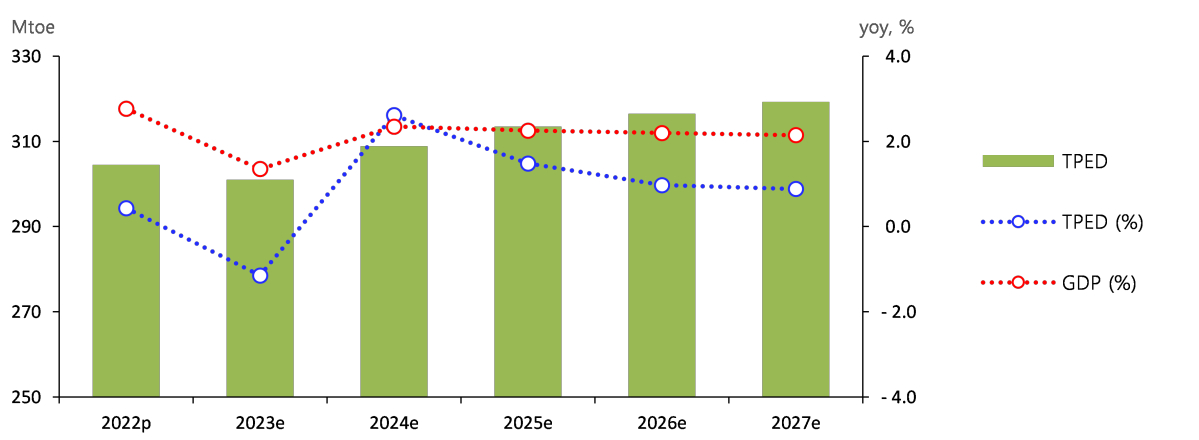
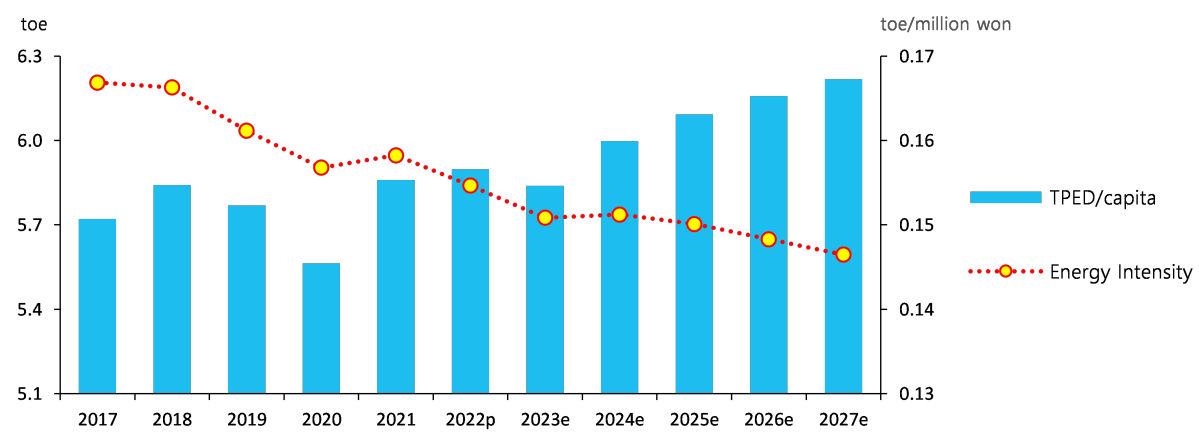
TPED is expected to grow by 1.0% on annual average between 2022 and 2027, reaching 319.3 Mtoe by 2027.
TPED is likely to drop in 2023 amid a slowdown in the economic growth and grow in the mid-2% range in 2024 along with an economic recovery. Since then, it is expected to grow at slower rate of 1%.
Trend in GDP & TPED growth rates
Energy intensity that has recently improved rapidly is forecast to improve at a slower rate of around 1% on annual average during the outlook period.
Energy intensity (toe/million won) has improved (declined) rapidly at an annual average rate of 1.5% for the past five years, but the rate of improvement is expected to drop to 1.1% on annual average during the outlook period.
TPED per capita and energy intensity outlook
Nuclear energy, renewable & other energy and natural gas are forecast to lead the growth in TPED, while coal demand is expected to decrease.
Nuclear generation is estimated to grow by 0.8% on annual average with the commissioning of three large-scale new reactors during the outlook period. The growth, however, will be limited, as the maintenance work will be conducted at several aging reactors for their continued operation.
Renewable & other energy demand is projected to grow faster than other energy sources, at an annual average rate of 5.5% during the outlook period, although the growth rate will be much lower than in the past due to less investment in solar PV installations. [3]
Petroleum demand is estimated to increase by 0.5% on annual average during the outlook period, even though it declines in the building sector and remains flat in the transport sector, as its industrial demand increases due to the construction of new petrochemical facilities.
Industrial coal demand is expected to increase partly due to the base effect, while it is likely to decrease in the transformation sector owing to a shortage of transmission lines and government policies aimed at reducing coal-fired generation. Consequently, the coal demand is projected to drop by 0.7% on annual average during the outlook period.
Energy demand growth rates by energy source
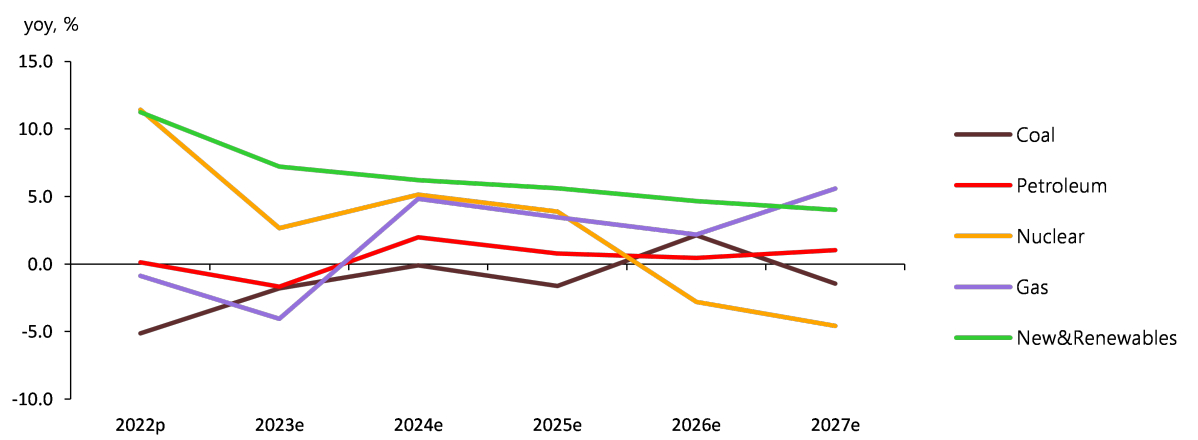
Gas demand is expected to increase at an annual average rate of 2.4% during the outlook period, despite lower city gas demand, as industrial entities' demand for directly imported natural gas increases quite strongly as well as the demand from the power generation sector.
Electricity demand is expected to grow at an annual average rate of 1.4% during the outlook period, as it increases relatively fast in the commercial sector amid a rapid growth in service businesses and the expansion of data center infrastructures, although it remains rather stagnant in the industrial and residential sectors.
Energy demand growth rates forecast by end-use sector
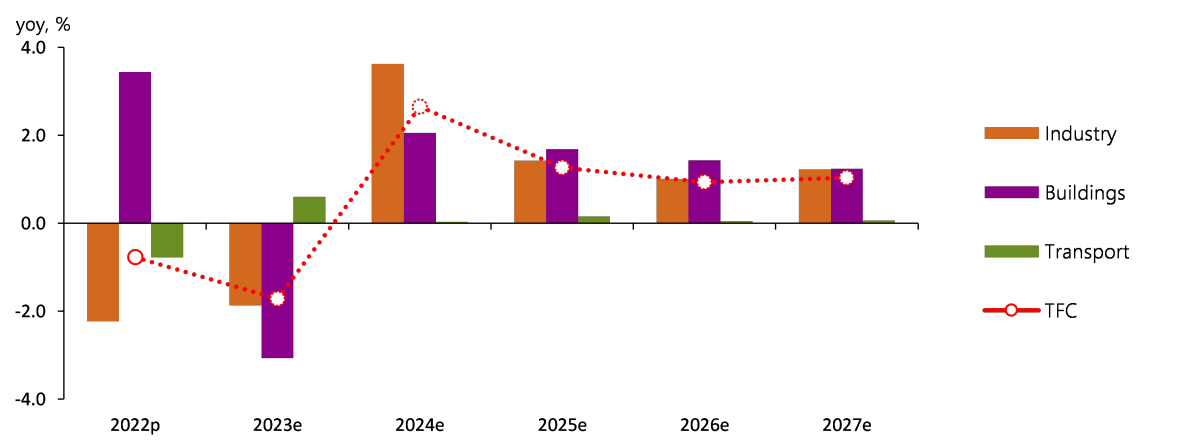
TFC is forecast to increase by 0.8% on annual average during the outlook period, reaching 223.0 Mtoe in 2027.
TFC is expected to drop by around 2% in 2023, mostly the industrial and building sectors, and based on this forecast, the annual average growth rate of TFC is estimated to be less than 1% during the outlook period.
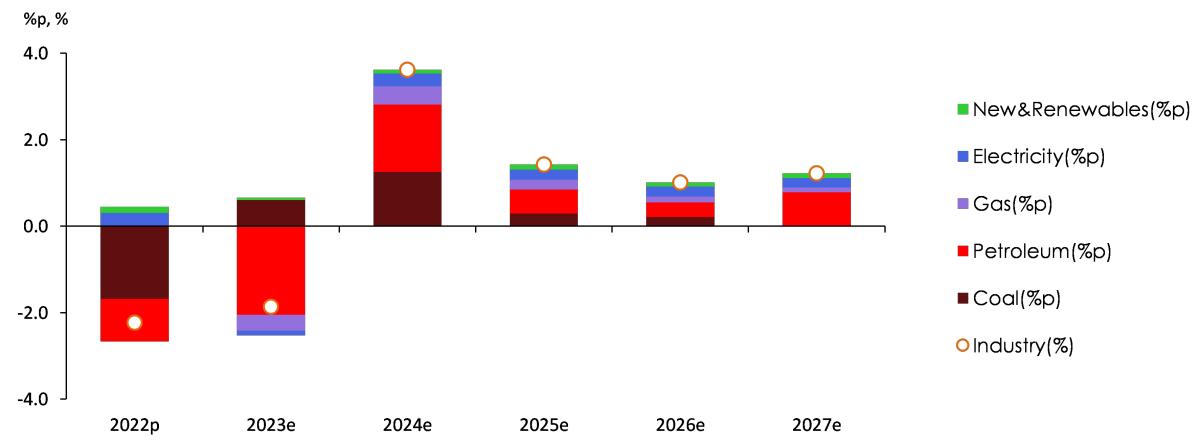
Industrial energy demand is expected to fluctuate widely during the early outlook period according to the domestic and global economic conditions, and then, it is expected to grow in the low 1% range. On an annual average during the entire outlook period, it is projected to grow by 1.1%.
Contribution by energy source to fluctuation of industrial energy use
In the transport sector, energy demand is expected to be flat, growing at an annual average rate of 0.2%, due to the relatively high oil price and slower economic growth.
In the building sector, energy demand is forecast to grow by only 0.7% per year on average during the outlook period, as energy consumers' sentiment is weakened by rising electricity and city gas prices, and the energy efficiency of buildings and appliances steadily improves.
Key Features and Implications
Transmission constraints and decrease of coal-fired generation
Constraints on transmission lines and a consequent decline in coal-fired generation are among the most important issues during the upcoming five years.
Recently, new large-scale generation projects (incl. nuclear & coal) have been rapidly increasing in the east coast area, but the construction of transmission lines has been delayed due to local communities' concerns, heightening the issue of transmission line constraints between the Seoul metropolitan and east coast areas.
Trend in power generation & transmission capacity
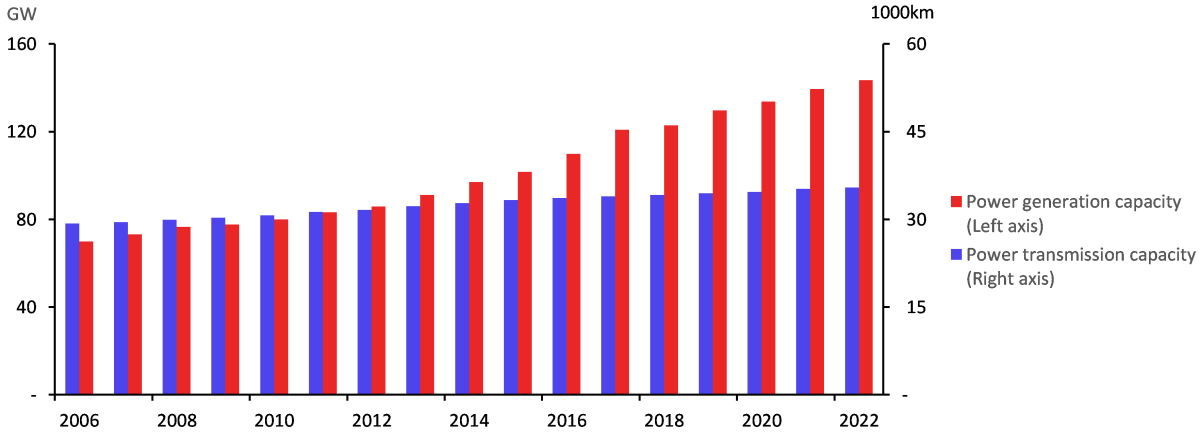
Source: Figure 3.1 is drawn by the author using the data from KEPCO's 'Statistics of Electric Power in Korea (Series No. 92, 2022)'.
In addition, the recent rapid deployment of new solar PV installations was concentrated in the Honam region, triggering the issue of insufficient transmission infrastructure between the Honam region and the Seoul metropolitan area. Accordingly, power reduction at nuclear power plants was planned during light-load hours in 2023.
The transmission constraint issue has led to a drop in coal-fired generation that is given a lower priority in power generation than renewable and nuclear energy. This situation is likely to continue throughout the outlook period.
Monthly baseload generation (incl. renewables) since 2020
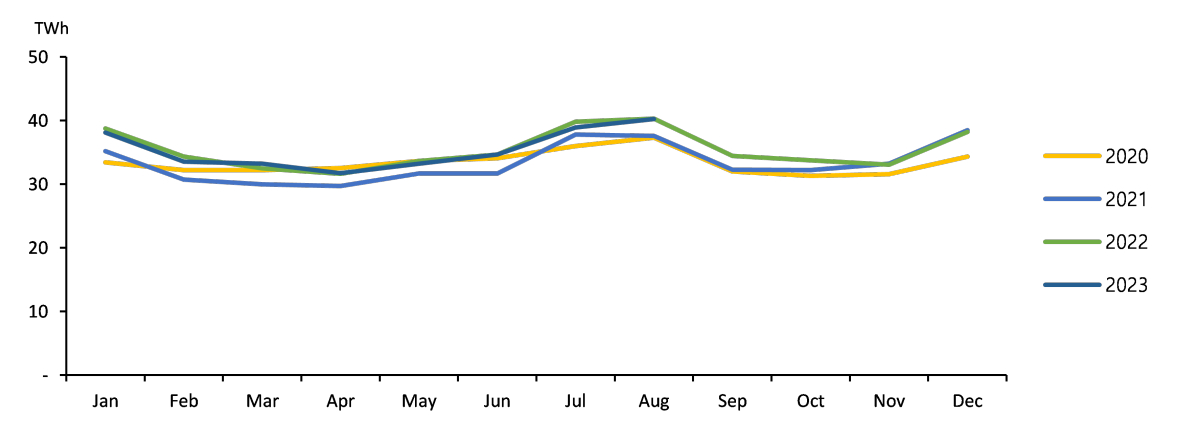
Note: In graph above, the baseload generation includes nuclear, coal and renewable energy generation.
Source: Figure 3.2 was drawn by the author using the data from KEPCO's 'The Monthly Report on Electric Power Statistics'.
Considering such an issue, this report forecasts a rapid decline in coal-fired generation during the outlook period. Although it is expected to slightly increase in 2026, as the east coast area's transmission line issue is addressed, it will be followed by another downward trend in 2027.
To build a large-scale petrochemical facility, the Shaheen project
Outline of Shaheen project
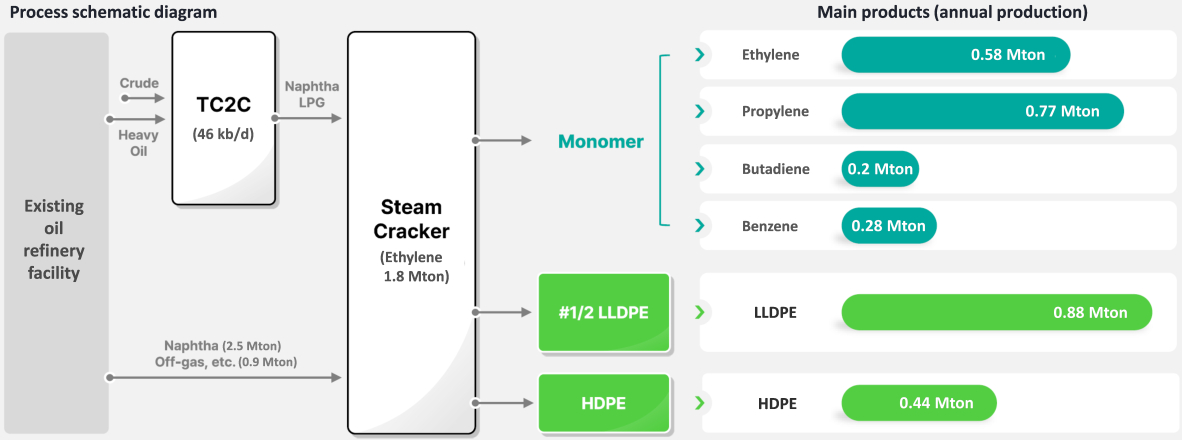
Source: Shaheen Project Investor Relations documents (2022.11.)
S-Oil is building one of the largest petrochemical facilities in the world, and the production of petrochemical feedstocks is expected to increase from 2027.
S-Oil's Shaheen project aims to build a decomposition facility of crude oil & its residues as well as a steam cracker with an ethylene production capacity of 1.8 million tons per year in Ulsan by the first half of 2026.
The Thermal Crude to Chemicals (TC2C) technology will enable an annual production of around 1.5 million tons of naphtha and 100,000 tons of LPG, and if the steam cracker operates at its full capacity, the domestic demand for petroleum products is projected to grow by around 13 million barrels.
Economic growth scenarios
TPED is projected to increase at an annual average rate of 1.3% in the high economic growth (HEG) scenario and 0.5% in the low economic growth (LEG) scenario.
The HEG and LEG scenarios were developed considering economic uncertainties during the outlook period (2023-2027).
TPED and TFC outlook across three scenarios
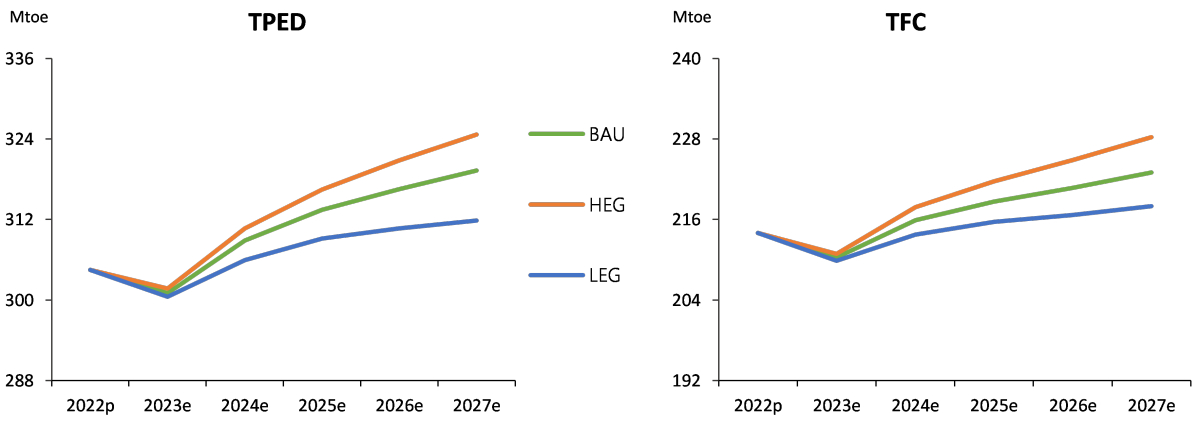
In the HEG scenario, TPED grows by 1.3% on annual average to reach 325 Mtoe in 2027. In the LEG scenario, it grows by 0.5% on annual average to reach 312 Mtoe in 2027.
TPED & TFC outlook in 2027 across three scenarios
[1] The lowercase p and e, which are added to each year, indicates provisional and forecast values, respectively.
Attachments-
N_중기.jpg
Download
-
_Midterm_Energy_Outlook(2022~2027).pdf
Download
View Details
-
Korea Mid-term Energy Demand Outlook (2021-2026)
- Date2022/08/22
- Author Energy Outlook Research Team
- Number of downloads 21
-
Download multiple files Download the entire file
Total Primary Energy Supply and Total Final Consumption
Total Primary Energy Supply ("TPES") went up by 0.8% on annual average between 2016 and 2021, reaching 305.3Mtoe.
TPES grew by 2-3% annually from 2016 to 2018 and then dropped by 1.5% and 3.6% respectively in 2019 and 2020. In 2021, it grew by 4.5% due to base effect of the decline in previous years.
TPES & GDP growth rates and fluctuation of manufacturing production index
TPES peaked at 307.6Mtoe in 2018 and then declined for two consecutive years. It strongly rebounded to 305.3Mtoe in 2021, though it was still lower than the 2018's record.
Energy intensity improved rapidly until 2020 but slightly deteriorated in 2021.
Energy intensity (toe/KRW 1 million), which is an indicator of energy efficiency, improved (dropped) faster from 2016 to 2020 than in previous years.
In 2021, the economy and energy consumption grew rapidly, as the economic activities picked up fast after the COVID-19 slowdown. Energy intensity slightly increased, with TPES (4.5%) growing faster than GDP (4.0%).
Contribution by energy source to fluctuation of total energy consumption
For the past five years, gas and nuclear energy use remained stagnant, and coal use declined, while gas and renewable energy use increased quite fast.
Petroleum use kept fluctuating between 2016 and 2021, affected by the rise and fall of oil prices and COVID-19 crisis. In 2021, it grew by mere 0.2% to 932.2Mbbl, which is similar to the 2016's record.
TPES growth rates by energy source
Coal use had surged until the early 2010s, led by the power generation and steelmaking sectors, however, it declined by 2.0% on annual average from 2016 to 2021 due to the sluggish iron & steel business and the government's restriction on coal-fired power plants, which was aimed at reducing fine dust and greenhouse gas emissions.
Natural gas use posted an annual growth rate of 5.6% between 2016 to 2021, as it grew fast in the power generation sector, driven by the energy transition policy, and as its final use also increased especially in the industrial sector.
Generation capacity trends by energy source
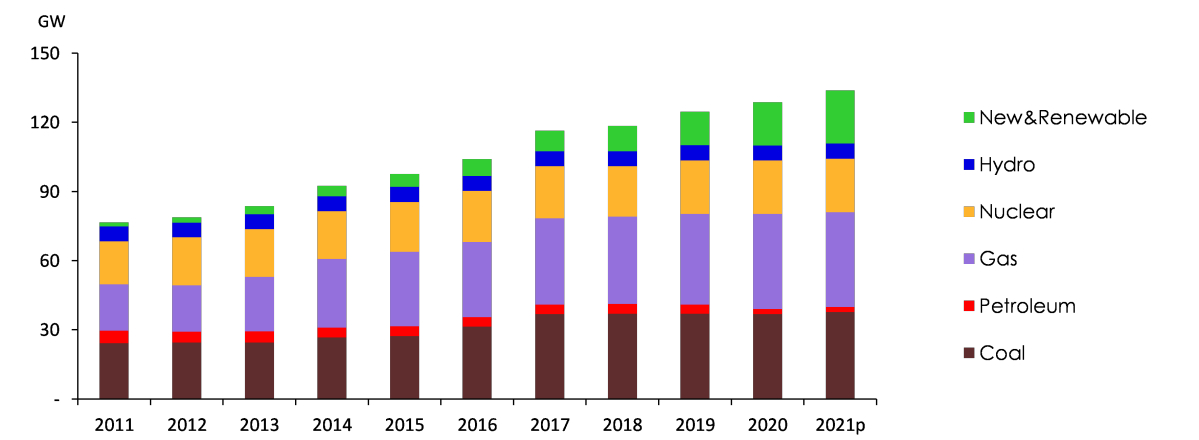
Nuclear generation decreased by 0.5% on annual average from 2016 to 2021, despite the growth in installed capacity, as preventive maintenance was extended due to the nuclear phase-out policy that started in the aftermath of the Gyeongju and Pohang earthquakes, and accordingly nuclear capacity factor declined.
Renewable & other energy use jumped 8.1% annually from 2016 to 2021 as a result of the government policy to expand the renewable energy deployment.
Electricity use grew at an annual rate of 1.4% from 2016 to 2021 and fluctuated widely, which was affected by abnormal weather conditions such as heat and cold waves as well as more volatile production during the COVID-19 pandemic.
TFC growth rates by end-use sector
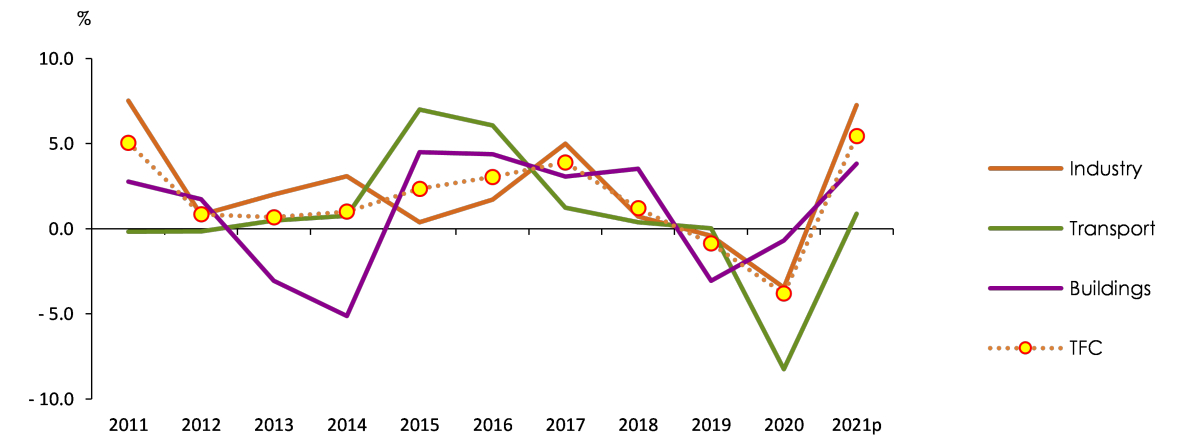
TFC increased at an annual rate of 1.1% from 2016-2021 to reach 234.7Mtoe.
Industrial energy use, which accounts for the largest share of TFC, grew by 1.7% on annual average between 2016 and 2021, leading the growth in TFC.
Heating & cooling degree days and energy use in buildings
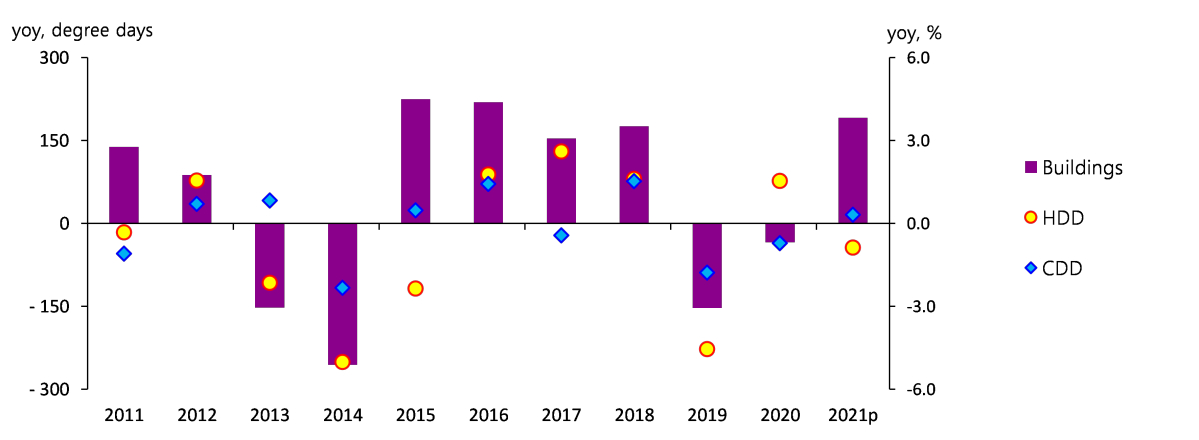
Energy use in buildings had been growing at slower pace due to the stagnant population growth and enhanced energy efficiency. From 2016 to 2021, however, it grew quite strongly at an annual rate of 1.3%, affected by abnormal weather events such as heat and cold waves.
Transport energy use declined by 1.2% on annual average from 2016 to 2021, as the sector has not been fully recovered from the impact of COVID-19.
TPES & TFC Outlook[1]
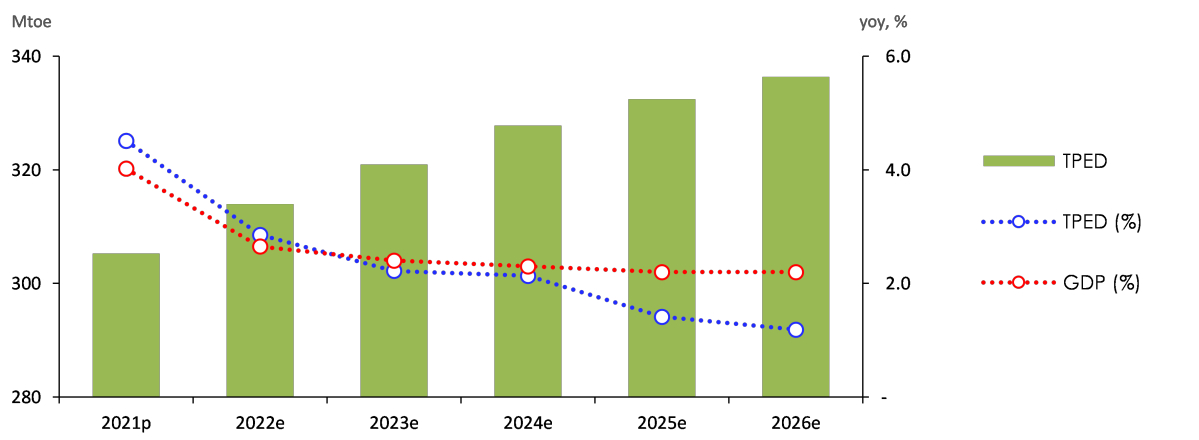
TPES is expected to grow by 2.0% on annual average from 2021 to 2026, reaching 336.4Mtoe in 2026.
TPES is expected to grow fast in the early outlook period, as the economy recovers from the impact of COVID-19 and stabilizes at lower level of 1-2% in the later period.
TPES outlook
Energy intensity has rapidly improved in recent years, but it is expected to improve at much slower pace during the current outlook period.
Energy intensity (toe/KRW 1 million) had rapidly improved(declined) at an annual rate of 1.5% for the past five years, but the rate of improvement is projected to slow down to 0.4% on annual average during the outlook period.
Energy consumption per capita and energy intensity outlook
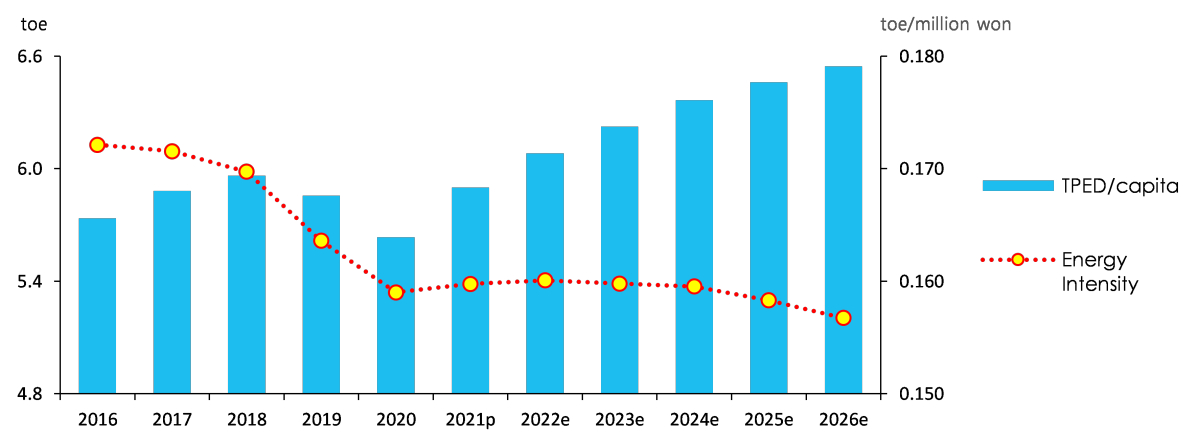
Energy consumption per capita is projected to increase from 5.9toe in 2021 to 6.5toe in 2026, at an annual growth rate of 2.1%.
Nuclear energy and renewable & other energy are expected to lead the growth in TPES, while coal demand declines.
Nuclear generation will grow at an annual rate of 2.7% during the outlook period, despite the retirement of several old nuclear plants[2], as its installed capacity increases with the commissioning of four large-scale nuclear plants, and the capacity factor increases to the low to mid 80% range.
Renewable & other energy[3] generation is expected to grow fast, especially solar PV, with strong political support for renewable energy deployment, and accordingly, the demand is forecasted to grow by over 10% on annual average during the outlook period.
Petroleum demand is likely to grow at an annual rate of 1.8% during the outlook period, led by petrochemical feedstocks such as naphtha and LPG and growing demand from the transport sector.
Contribution by energy source to fluctuation of total energy consumption
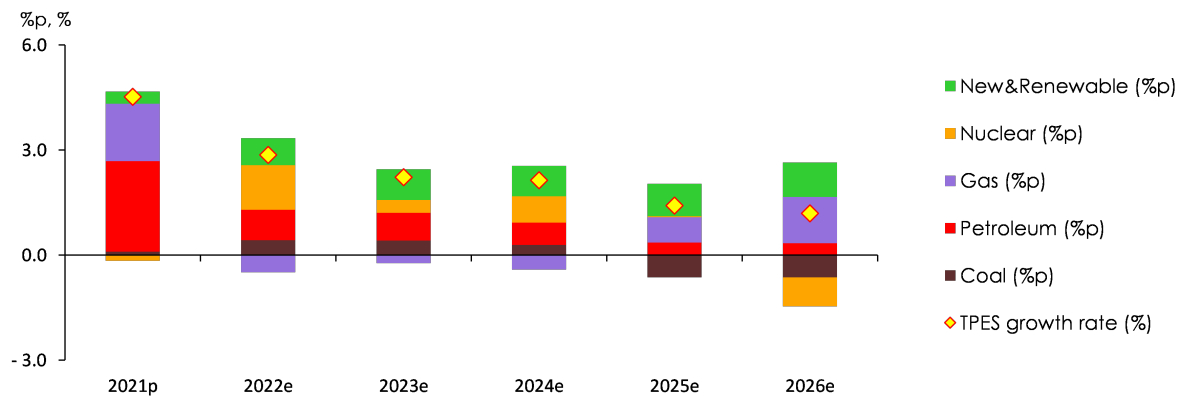
Coal demand is expected to decline by 0.3% on annual average, despite a steady growth in demand in the end-use sectors, as it declines in the power generation sector due to the shutdown of several old coal power plants later in the outlook period.
Natural gas demand is projected to grow by mere 1.1% on annual average during the outlook period, despite growing demand in the end-use sectors, as it remains stagnant in the power generation sector due to global LNG price hikes and increased baseload generation, especially nuclear generation, early in the outlook period.
Electricity demand of the end-use sectors is expected to grow quite fast early in the outlook period, owing to the recovery from COVID-19, but later, it is likely to grow at much slower pace, posting an average growth rate of 2.0% annually during the outlook period.
Contribution by end-use sector to fluctuation of final energy consumption
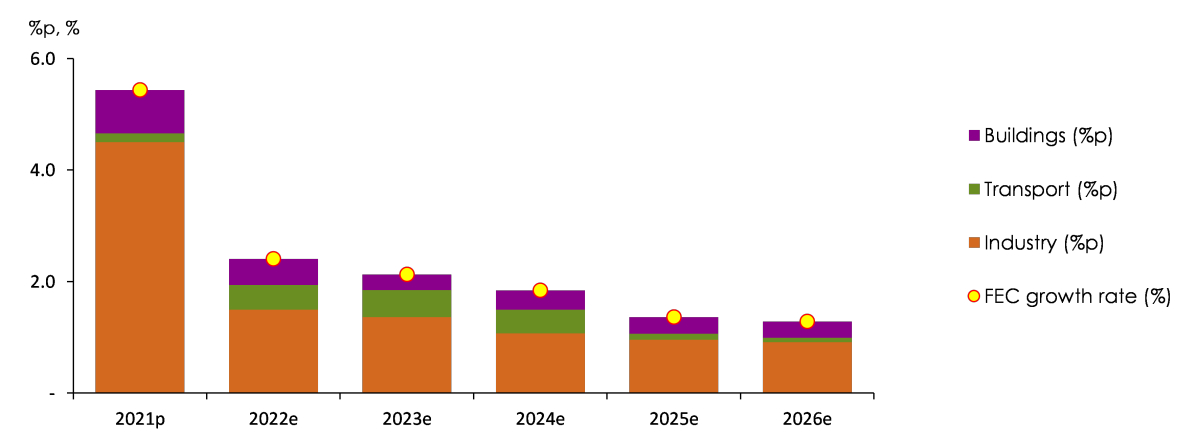
Energy demand in the end-use sectors is projected to grow at an annual rate of 1.8% during the outlook period to reach 256.6Mtoe in 2026.
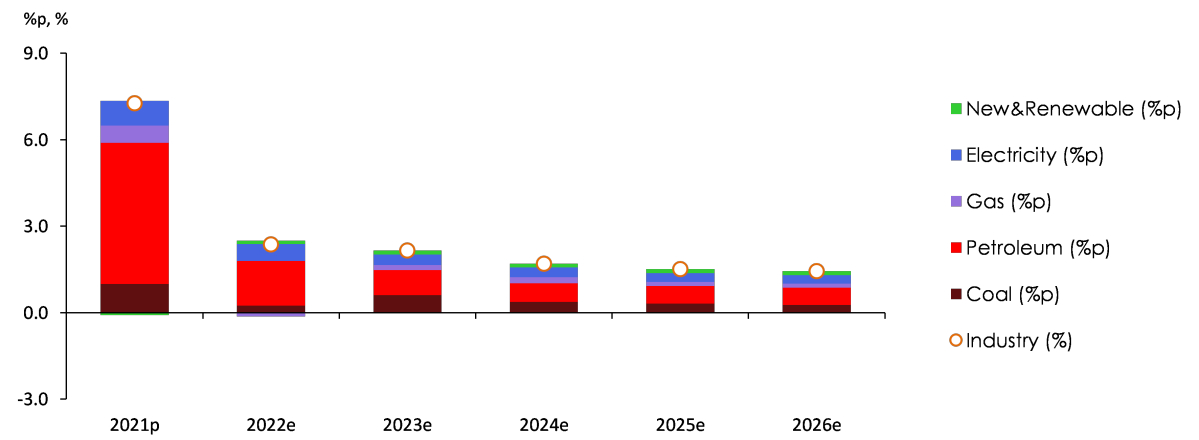
Industrial energy demand is projected to increase at an annual rate of 1.8% during the outlook period, driven by enhanced production activities. The demand growth rate, however, is likely to drop from 2.4% to 1.4%, as the pace of economic growth slows gradually.
Contribution by energy source to fluctuation of industrial energy use
Since 2020, transport energy demand plunged due to the impact of COVID-19, and then it has been stagnant. During the outlook period, the demand is expected to recover, growing at an annual rate of 1.8%, with the road transport and aviation sectors leading the growth.
In the building sector, energy demand is estimated to grow at an annual rate of 1.7% during the outlook period, with the commercial sector leading the growth, and the demand for electricity and gas will be particularly strong among energy sources.
Key Features and Implications
Energy Supply Chain Crisis and Energy Price Outlook
Global energy prices are expected to maintain the upward trend for a while amid ongoing instability in energy supply chain, although there is a high degree of uncertainty.
As the COVID-19 pandemic eased, global oil price started a strong upward move since 2H 2021, and the war in Ukraine is further pushing up the price. However, there is an expectation of a drop in oil price considering the possibility of a global economic recession.
Global oil price (Brent oil) outlook dot plot (US$/bbl), as of July 2022
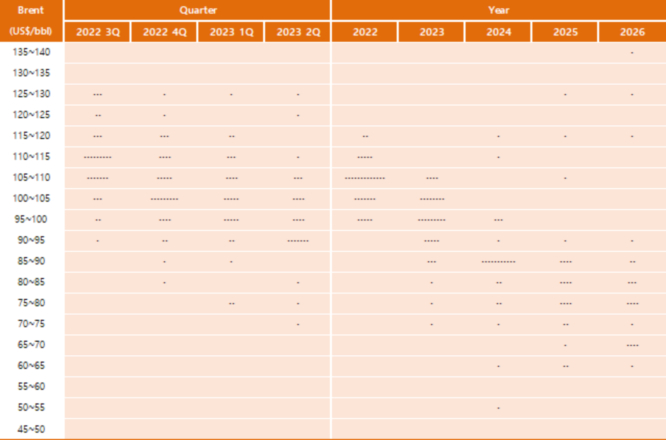
Source: Refinitiv Eikon, "Reuters Commodity Polls"(2022.7.29)
A group of experts reached a consensus on an expectation that oil prices will remain high until 2023 and then stabilize at low level.
Comparison of global oil price outlooks of April and July (brent oil)
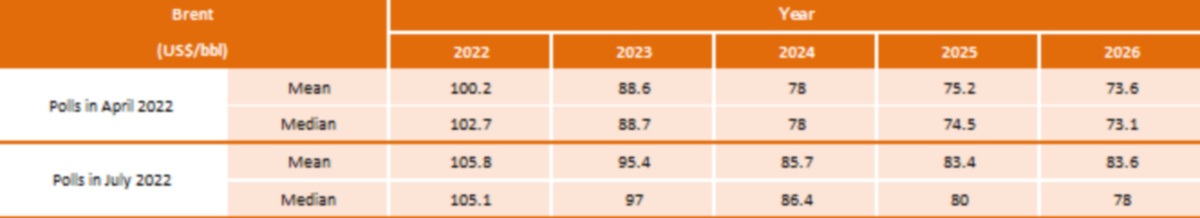
Source: Refinitiv Eikon, "Reuters Commodity Polls"(2022.4.29./2022.7.29)
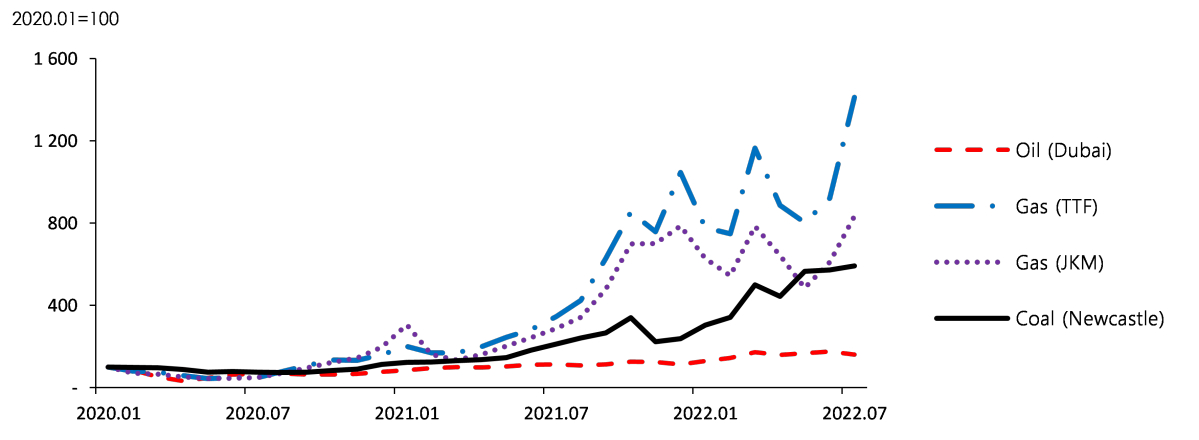
Global natural gas (LNG) and coal prices surged after the outbreak of the war in Ukraine and once temporarily declined, but since then, they have been on an upward trajectory, as uncertainties are growing amid the prolonged war in Ukraine and a new cold war.
Global energy price trend
Economic Growth Scenario
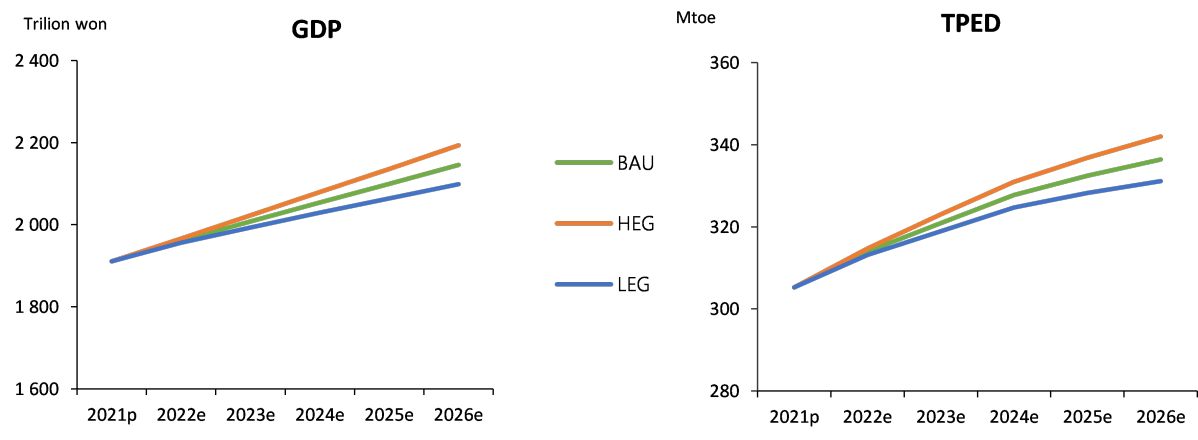
TPES is forecast to grow at an annual rate of 2.3% in the high economic growth("HEG") scenario and 1.6% in the low economic growth("LEG) scenario during the forecast period.
The HEG and LEG scenarios were developed in consideration of the economic uncertainties during the outlook period (2021-2026).
In 2026, TPES is expected to reach 342Mtoe in the HEG scenario and 331Mtoe in the LEG scenario.
GDP assumptions and TPES outlook across three scenarios
In the HEG scenario, TFC grows by 2.2% on annual average to reach 262Mtoe in 2026, while in the LEG scenario, it grows by 1.4% on annual average to reach 252Mote in 2026.
TPES & TFC outlook in 2026 across three scenarios
Energy intensity improves by 0.5% on annual average in the HEG scenario, reaching 0.156(toe/KRW 1 million) in 2026, while it improves by 0.3% on annual average in the LEG scenario, reaching 0.158(toe/KRW 1 million) in 2026.
Life extension of old nuclear power plants scenario
The new government's energy policy suggests that a number of old nuclear reactors that were set to be retired are highly likely to get life extension.
According to the 9th Electricity Demand and Supply Master Plan (Ministry of Trade, Industry and Energy, Dec. 2020), the commissioning of four new reactors and the shutdown of six old reactors were planned between 2022 and 2026.
However, the new government, which took office in May, announced the plan to scrap the former government's nuclear phase-out policy, suggesting that it will consider extending the life of old reactors that were scheduled to be shut down as stipulated in the Electricity Supply and Demand Master Plan.
The business-as-usual("BAU") scenario in this report was established based on the generation facility plan of the 9th Electricity Supply and Demand Master Plan. However, there is a high possibility of granting life extension to old nuclear reactors instead of the retirement in the 10TH Electricity Supply and Demand Master Plan, which is being drawn up as of July 2022.
If all of the old nuclear reactors continue to operate, nuclear energy will emerge as the largest power generation source by 2026.
If the six reactors (5.2GW), which are scheduled to be retired between 2022 and 2026, continue to operate, the nuclear installed capacity is projected to reach 28.9GW by 2026.
The BAU scenario assumed that the average capacity factor of nuclear power units would be in the low 80% range in 2026. If the same capacity factor is applied to the "life extension" scenario, nuclear generation is estimated to be 209TWh, accounting for 33% of the total power generation.
2026 Power generation mix in the BAU & life extension scenarios
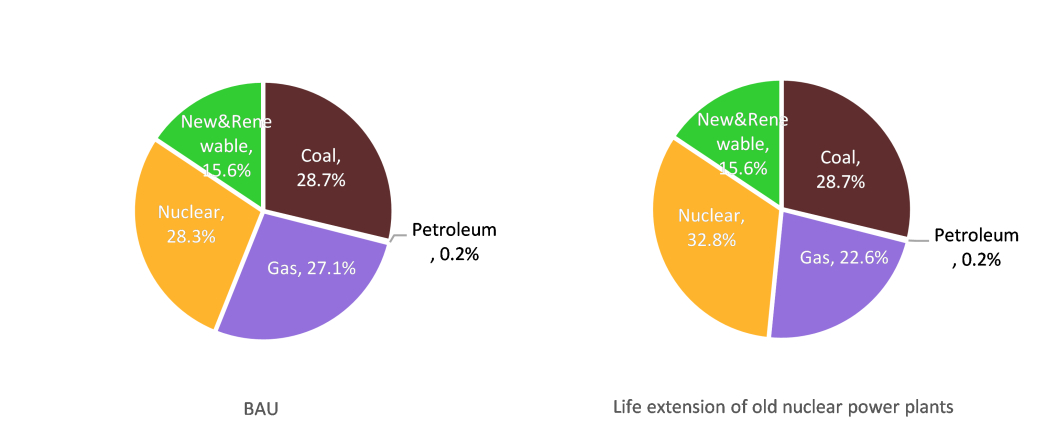
In the case of extending the life of all the old nuclear reactors instead of shutting them down, greenhouse gas emission from the power generation sector is expected to drop by 4.9% compared to the BAU scenario as of 2026.
[1] The lowercase p and e, which are added to each year, indicates provisional and forecast values, respectively
[2] Generation facility plan in this outlook is based on "the 9th Electricity Supply and Demand Master Plan".
[3] Power generation from renewable energy sources such as solar PV, wind energy, hydropower (pumped storage excluded), ocean energy, bio energy and new energy sources such as fuel cell, IGCC as well as pumped storage and waste & other energy sources are included.
Attachments-
KEEI_중기_에너지수요전망(2021~2026)_페이지_001.jpg
Download
-
Mid-term_Energy_Demand_Outlook(2021~2026).pdf
Download
View Details
-
Korea Mid-term Energy Demand Outlook (2020-2025)
- Date2021/07/26
- Author Energy Demand and Supply Research Team
- Number of downloads 19
-
Download multiple files Download the entire file
Total Primary Energy Supply and Total Final Consumption
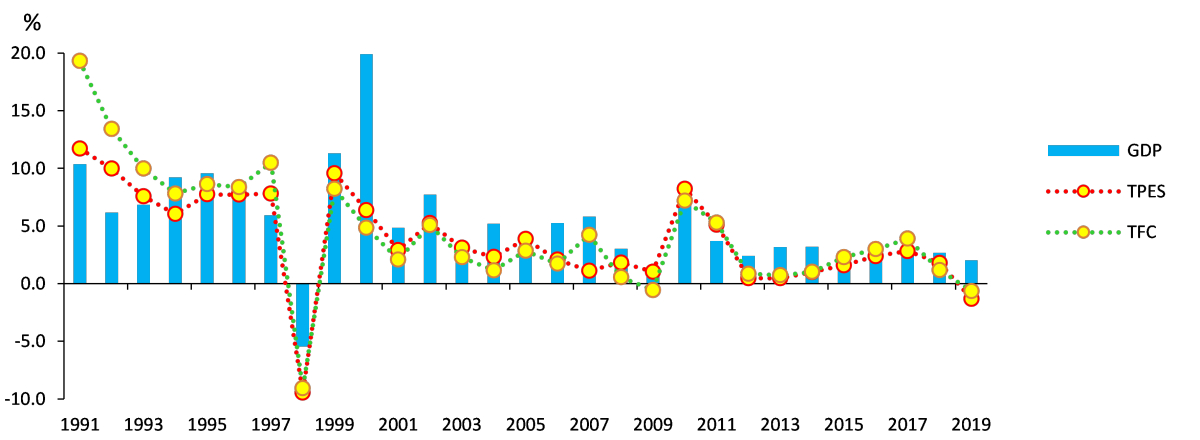
Total Primary Energy Supply (“TPES”) recorded an annual average growth of a mere 0.3% from 2015 to 2020 due to the recent decrease in TPES for two consecutive years
From 2016 to 2018, TPES kept increasing at a level of 2-3%. However, the annual average growth of TPES declined to around 0% from 2015 to 2020 as TPES increase rates for 2019 and 2020 were 1.5% and -4.0%, respectively, posting a drop for two years in a row
TPES, TFC and GDP growth rates
Similarly, Total Final Consumption (“TFC”) posted annual average growth rates of 1-4% from 2016 to 2018. For 2019 and 2020, however, the growth decreased by 0.9% and 4.0%, driving TFC to post an increase of a mere 0.6% from 2015 to 2020
In recent years, overall energy use went up at a slower rate with slow economic growth and industrial structure changes and in 2020, energy consumption fell considerably as production activities suffered a downturn amid COVID-19 pandemic. As a result, the annual growth rate of energy consumption experienced a significant fall to a 0% level from 2015 to 2020
Energy Intensity rapidly recovered with a slowdown in energy consumption growth and decreased use in recent years
Energy Intensity (toe/million KRW), an index used for measuring national energy efficiency, recovered (declined) from 2015 to 2020 at a rate faster than before
However, caution should be exercised when assuming that these changes in energy intensity are directly related to improvement in energy efficiency. Because in 2019, there were unrelated factors such as temperature effects, and in 2020, the unexpected COVID-19 pandemic played a greater role in declining energy consumption
Contribution by energy source to fluctuation of total energy consumption
In the recent five years, gas and renewable energy increased decently, while coal and nuclear energy declined with oil remaining stationary
Coal use grew fast mainly in the power generation and steel sectors until early 2010s. From 2015 to 2020, however, coal consumption posted an annual average decrease of 2.9% as the steel industry suffered a downturn and coal-fired generation was limited by the fine dust measures of the government
Comparison of annual growth by energy source
The growth of oil use slowed down with increased oil price to post a decline from 2015 to 2020. Especially, oil consumption dropped by 5.8% as industrial production slowed down and Social Distancing measures were put in place amidst COVID-19 pandemic
From 2015 to 2020, natural gas use increased by an annual average of 4.4% as the use for power generation went up rapidly with energy transition policies and the final consumption grew as well driven by a temperature effect and an increase in direct imports by the private sector
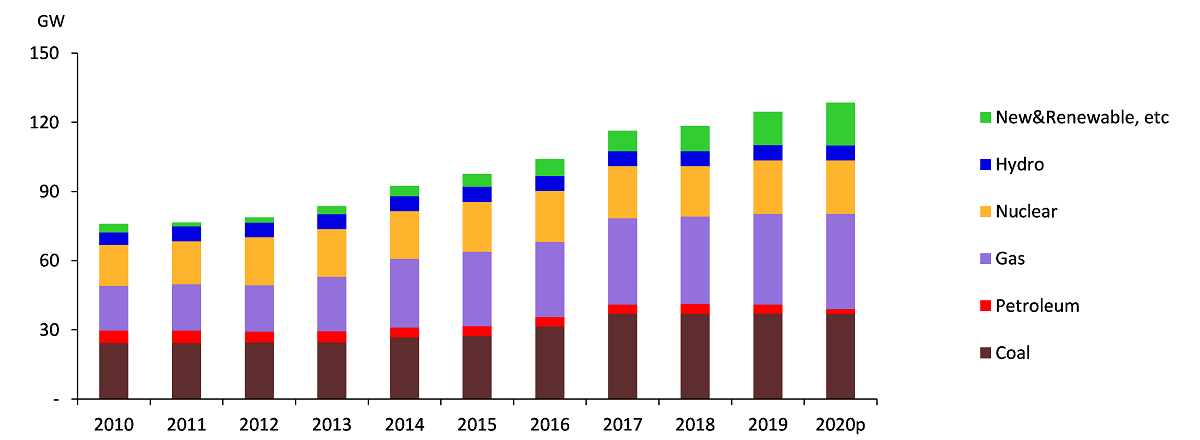
Generation capacity trends by energy source
Despite the rapid surge in 2019 and 2020, nuclear generation showed an annual average decline of 0.6% from 2015 to 2020 as two nuclear reactors were shut down and the number of preventive maintenance projects increased due to strengthened safety checks by the government
Renewable and Other energy use rose by an annual average of 7.2% from 2015 to 2020 thanks to the government’s Renewable energy dissemination policies
Entering into the 2010s, the growth in electricity use significantly slowed down to post an average increase of 1.0% from 2015 to 2020 driven by several factors, including a slowdown of economic growth, the energy demand management policies by the government and electrification becoming stagnant
Contribution of end-use sectors to fluctuation of TFC consumption
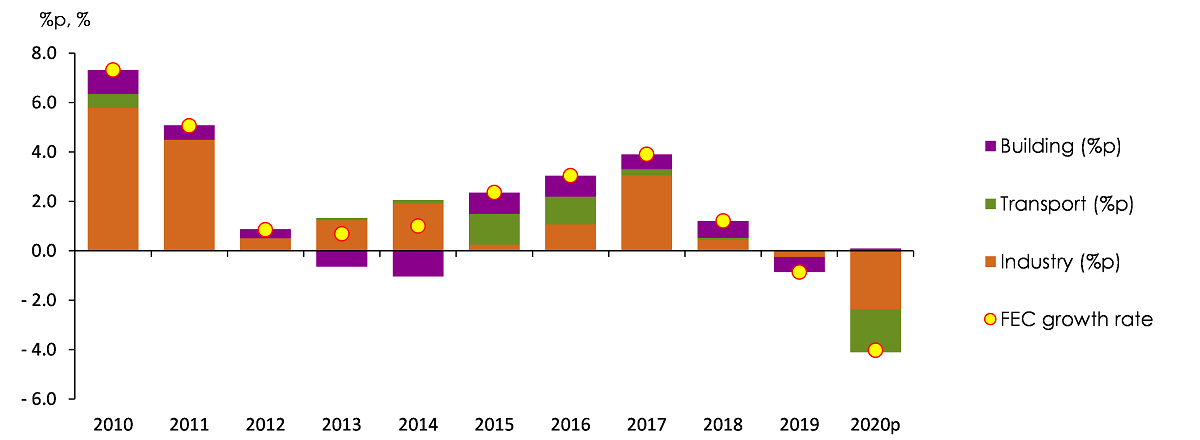
TFC increased in the industrial and building sectors, while dropping in the transport sector
From 2010 to 2015, industrial energy use showed an annual average increase of 2.7% mainly in the steel and petrochemical industries, which have high energy intensity. On the contrary, from 2015 to 2020, the annual average growth experienced a considerable decline to 0.6% as the steel industry started to decrease in energy consumption and the energy use in the petrochemical industry slowed down as well
Fluctuation in cooling and heating degree days & buildings’ energy use rates
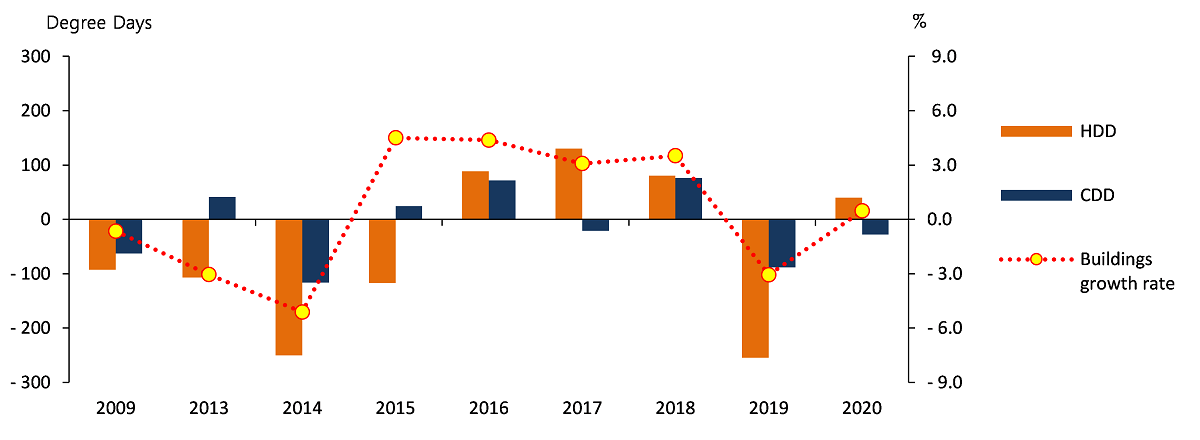
Note: The data for cooling and heating degree days shows year-on-year differences
Energy use in the building sector kept showing a decreasing trend due to stagnant population and increased energy efficiency. From 2015 to 2020, however, the growth added speed to post an annual average of 1.6% driven by abnormal temperature such as heat waves and cold snaps
In 2020, energy use in the transport sector declined by a whopping 9.4% upon the onset of COVID-19 pandemic, following a static period after 2017 with increased oil prices
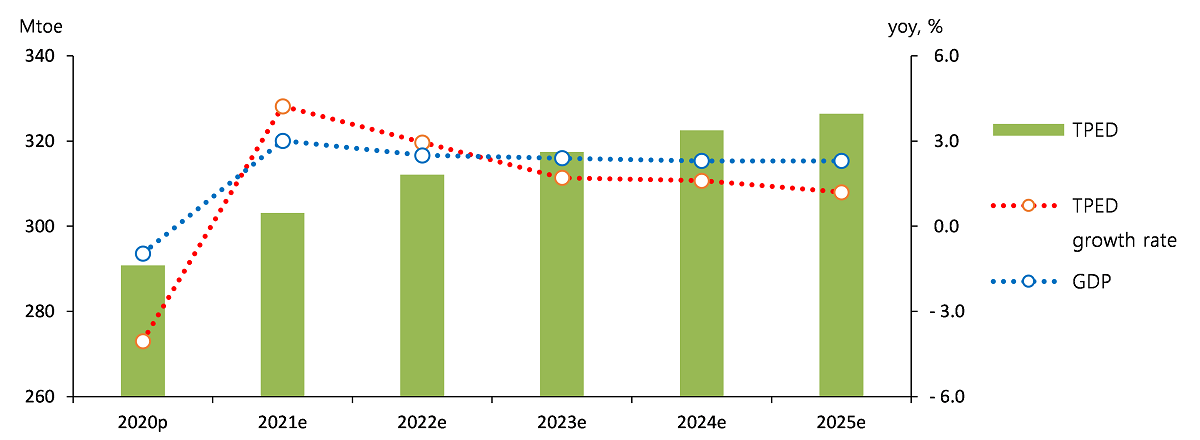
TPES & TFC Outlook[1]
From 2020 to 2025, Total Primary Energy Supply (“TPES”) is expected to grow by an annual average of 2.3% to reach 326.4 million toe by 2025
In the early stage of the forecast horizon, TPES is expected to increase dramatically with the national economy recovering from the impact of COVID-19 pandemic, followed by a stable phase in which TPES is likely to stay at a mid-1% level
TPES outlook
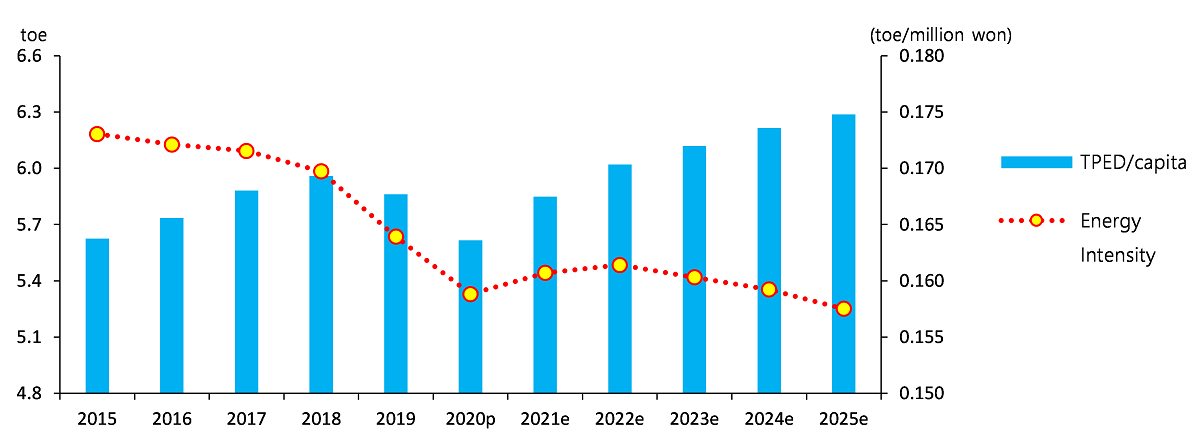
Energy intensity is expected to continuously improve. However, the improvement is expected to occur much slower compared to the past
Energy intensity, which has improved with an annual average fall of 1.7% over the last five years, will continue to improve over time for the forecast horizon. However, the improvement rate is expected to decline significantly to show an annual average of 0.2%
Energy consumption per capita is expected to go up at a high rate of an annual average increase of 2.3% from 5.6 toe in 2020 to reach 6.3 toe by 2025
Energy consumption per capita and energy intensity outlook
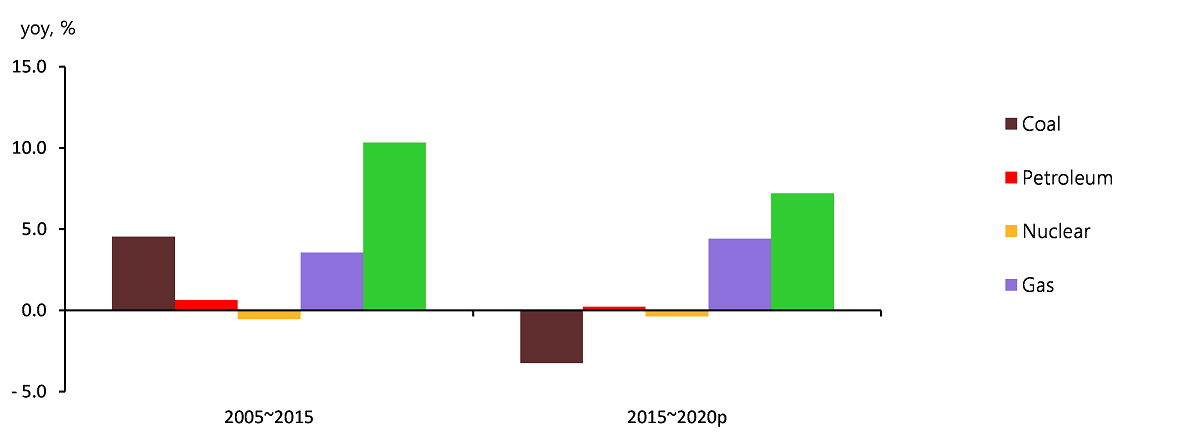
During the period under consideration, coal demand will stay at the current level while all other energy sources are expected to show a decent increase
The coal demand is forecast to post a mere annual average growth of 0.2%, as the consumption for power generation is likely to fall due to the limitations on coal-fired generation, offsetting the anticipated increase in the final use sector driven by the industrial sector
As the national economy is likely to recover from the impact of COVID-19 pandemic, the oil demand in the transport and industrial sector will rise in 2021. As a result, the demand is expected to continuously go up by an annual average of 2.5% for the forecast period
Contribution by energy source to fluctuation of total energy consumption
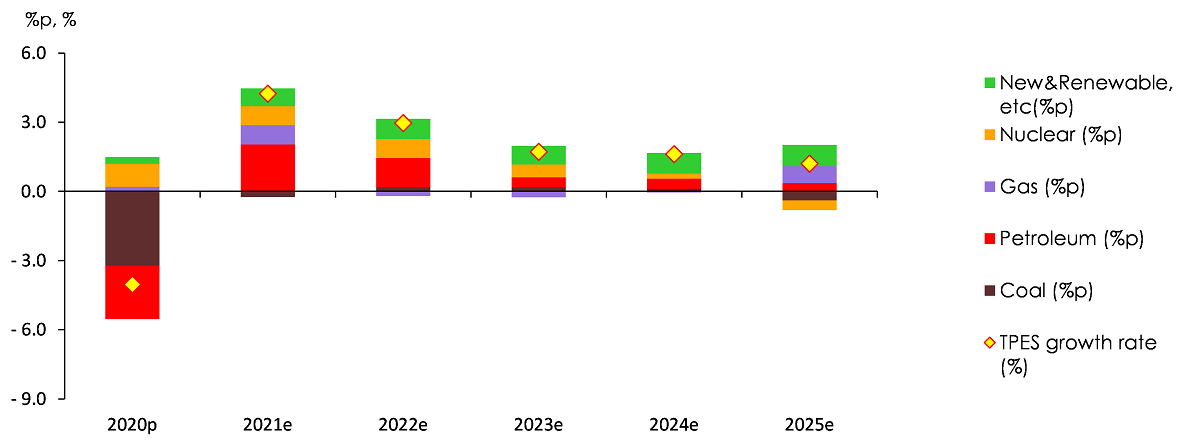
For the period under consideration, nuclear generation is forecast to grow by an annual average of 3.3% as 1.4 GW large-capacity reactors are planned to come online every year from 2021 to 2024 and the utilization rate for nuclear facilities is likely to be maintained at an early 80% level
Although the final consumption sector will witness a growth, natural gas demand is expected to show an annual average of a mere 1.1% increase as the gas demand in the power generation sector will drop due to the rise in base-load generation driven by nuclear power
New&renewable and other energy demand is anticipated to soar by an annual average of 10.7% from 19.9 million toe in 2020 to 33.2 million toe in 2025, thanks to the renewable energy dissemination policy by the government
Electricity demand in the final consumption sector is likely to rebound fast as the national economy will recover from the impact of COVID-19 pandemic in 2021. Accordingly, the demand growth is anticipated to stay around at a 2% level to bring the electricity demand up by an annual average of 2.2% for the forecast period
Contribution of end-use sectors to fluctuation of TFC consumption
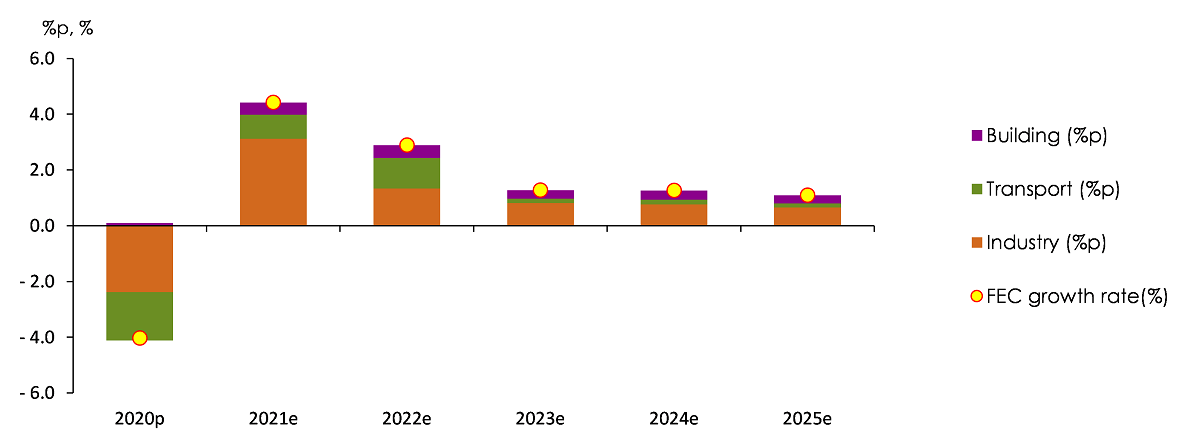
FEC by end-use sector is expected to grow by an annual average of 2.2% for the forecast horizon to reach 247.2 million toe in 2025
In the industrial sector, energy demand will rise by 5% with rapid economic recovery in 2021. Since then, however, the trend will slow down considerably to grow by an annual average of 2.1% for the forecast period
In the transport sector, which was hit the most by COVID-19 pandemic in 2020, energy demand is likely to post an annual growth of 2.7% for the forecast horizon. Specifically, the energy demand is expected to rise by 4.9% mainly in the road transport industry in 2021 and soar by 6.2% in 2022 thanks to a recovery in the air transport industry
Energy demand in the building sector is anticipated to go up, driven by the industrial sector (sector-wise) as well as electricity and gas (source-wise) to post an annual average growth of nearly 2% for the period under consideration
Key Features and Implications
Impact of COVID-19 pandemic on electricity consumption in 2020[2]
Although suffering from three waves of COVID-19 pandemic in 2020, Korea was successful in fighting against the spread with Social Distancing measures
Since the first COVID-19 confirmed case took place in Korea on January 21, 2020, a total of 156,961 cases were confirmed as of June 30, 2021 with the death toll reaching 2,018
Trend of daily COVID-19 caseload in Korea
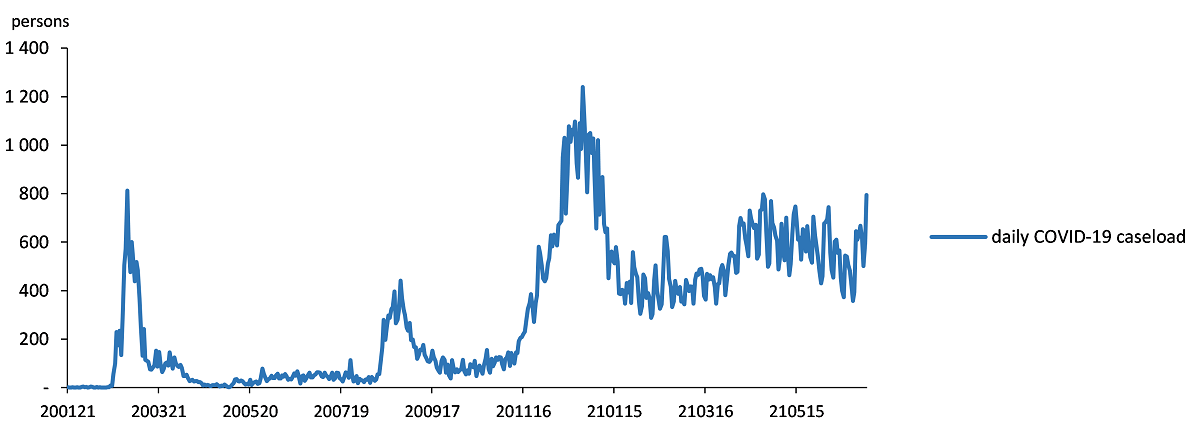
Source: https://github.com/jooeungen/coronaboard_kr/blob/master/kr_daily.csv, (2021.06.30)
Globally, COVID-19 pandemic has brought about massive changes onto energy consuming patterns and energy markets along with an economic downturn and behavioral changes in our life
It turns out that the impact of COVID-19 crisis drove down electricity consumption in most countries, with the fall depending on the intensity of the implemented lock down measures (IEA, 2020)
Spain, Italy, Belgium, the U.K. and other countries implementing a strict lockdown in the face of COVID-19 pandemic witnessed a dramatic fall in electricity consumption while Netherlands and Sweden, the countries resorted to light lockdown measures, experienced a relatively small drop in power use (BahmanyarAlireza, EstebsariAbouzar, ErnstDamien, 2020)
During the strict lockdown, electricity use in Spain plunged by 13.5% compared to the same period from 2015 to 2019 and especially, the power consuming patterns for daytime changed considerably (SantiagoI., et 2021)
Similarly, Korea experienced a year-on-year drop of 2.2% in electricity consumption due to the impact of COVID-19 with changing consuming patterns
Although electricity use in the consumption sector (residential building) decreased due to Social Distancing restrictions, in general, the overall electricity use declined as the production sectors including industrial and service sectors experienced a drop. However, the decline in the national electricity consumption is smaller compared to other major countries enforcing lockdown measures to fight against COVID-19 pandemic
Overall, electricity use decreased due to the impact of COVID-19 pandemic. However, there is no clear correlation between the increasing number of confirmed cases and the decline in electricity consumption
Yearly maximum electricity consumption slightly declined by 0.8% from 85.4 GW in 2019 to 84.7 GW in 2020, showing a minor impact of COVID-19 pandemic compared to the minimum power consumption, which plunged by 5.1%
Analyzing the change in energy consumption patterns for 2020 using Mahalanobis distance shows that the daily power consumption pattern for daytime changed in April, June and December. In terms of time period, a pattern change was observed for 4a.m.-4p.m. as well as 8p.m.-12a.m
2016-2019 Average Electricity Consumption vs. 2020 Electricity Consumption
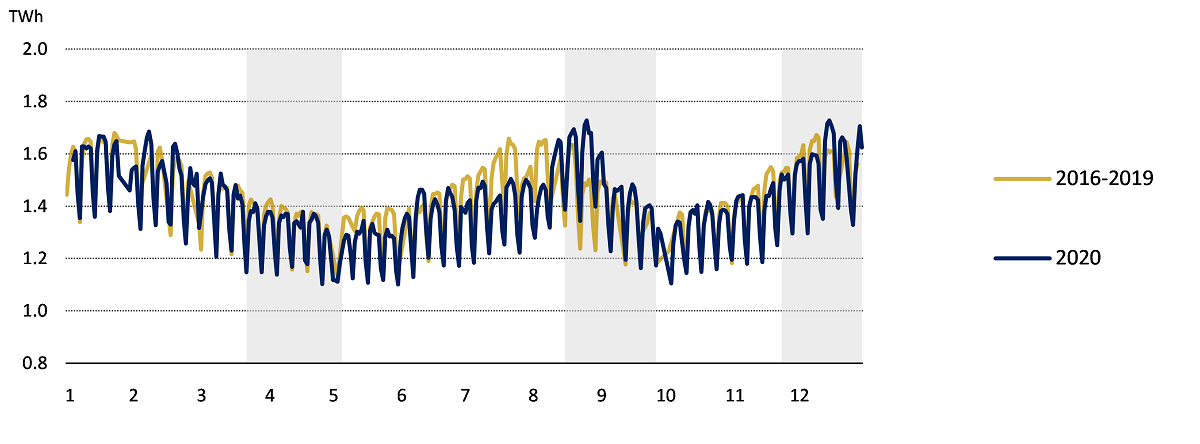
Source: Soo-il Kim (2021)p.16
In the face of COVID-19 pandemic, each sector displayed different electricity consumption patterns
The overall electricity consumption declined in the manufacturing sector. More specifically, the fall in minimum consumption, which has the lowest load, was greater compared to the fall in maximum consumption
In the past, the residential building sector had a pattern in which electricity use reached the morning peak before the rush hour, and then dropped until lunchtime. As more and more people work from home, the short peak before the morning rush hour disappeared and the electricity demand stays flat until lunchtime
Some service industries, which were hit the most by the impact of COVID-19 pandemic including Education, Food & Accommodation and Art, Sports & Leisure experienced changes in their electricity use pattern along with a decline in electricity consumption
Changes in GHG emissions in the power generation sector
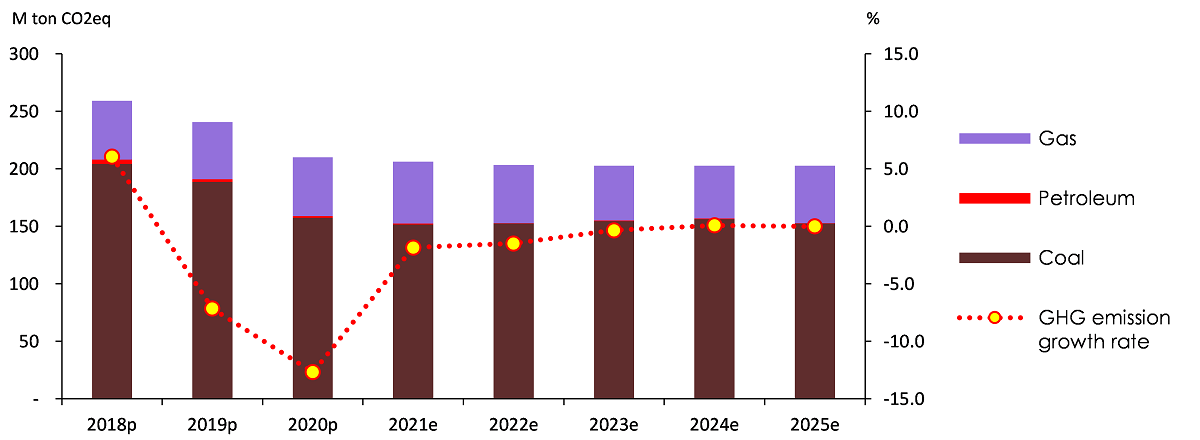
Although large-capacity coal-fired generation facilities are planned to come online during the forecast period (2020-2025), GHG emissions in the power generation sector are likely to go down
According to the ninth Basic Plan for Electricity Supply and Demand (issued by Ministry of Trade, Industry and Energy in December 2020), a total of seven coal-fired generating units with a capacity of 7.3 GW will be newly installed in the final stage of the government plan for coal generation. Shinseocheon-1 unit will be built in 2021 to be the first of the seven scheduled units while Samcheonpo-2 will be the last, planned to be installed in 2024
Nevertheless, the facility expansion will be partially offset as 10 out-of-date generation units equivalent to 4.7 GW are scheduled to be shut down from 2021 to 2025. Since the total coal-fired generation management system is going to be put in place along with the operation shutdown and coal-fired generation cap measures aiming at controlling fine dust, the volume of coal-fired generation and resulting GHG emissions are expected to decline slightly for the forecast horizon
Change in coal-fired and nuclear power generation capacity under the 9th Basic Plan for Electricity Supply and Demand (2021-2025)
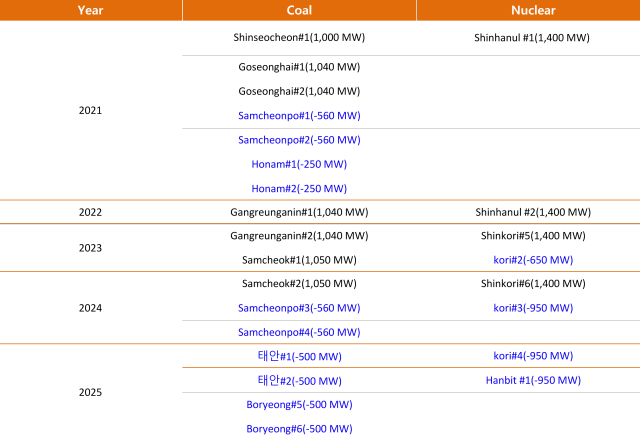
Source: The 9th Basic Plan for Electricity Supply and Demand, The generators highlighted in blue are scheduled to be shutdown
Note: After a prolonged approval process, Shinhanul-1 was finally given the green light in July. It will commence commercial operation on March 2022
Although electricity demand is likely to increase continuously for the forecast period, gas power generation will fall slightly with nuclear and renewable growing fast in power generation. Accordingly, GHG emissions caused by gas generation is expected to tick down
Changes in GHG emissions in the power generation sector for the forecast period
Petrochemical facility expansion
Thanks to the new installation and expansion of petrochemical facilities, the demand for naphtha and LPG is forecast to increase, driving a growth in energy demand in the industrial sector
Since 2014, many firms in the domestic and overseas petrochemical sectors continued to invest in plant and equipment to realize the economy of scale on the back of low oil prices, regardless of the demand for petrochemical products in the global market (Dongwon Sung, 2019.4.25)
The growth rates of industrial use and Naphtha & LPG(industry) & economic growth rates
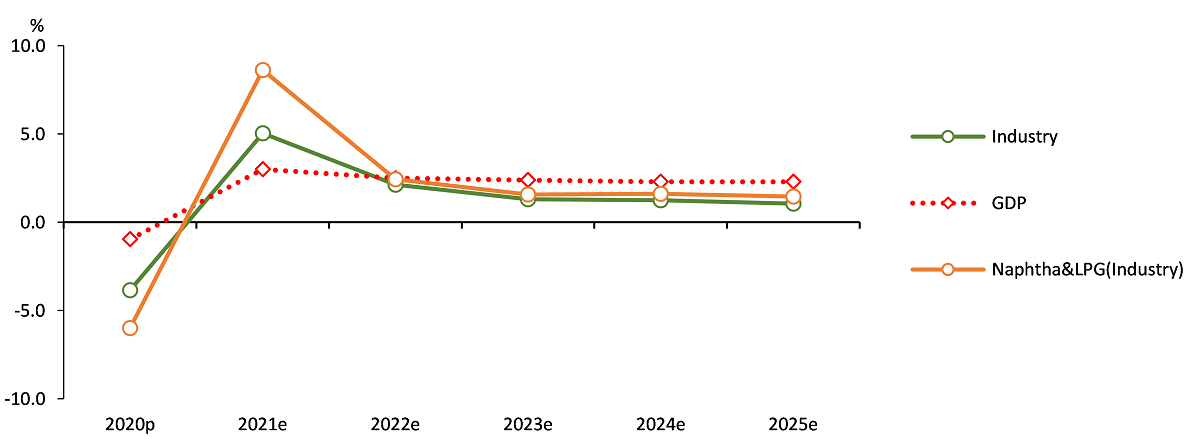
Note: Industrial energy includes the demand for raw materials such as naphtha
Thanks to the new installation and expansion of petrochemical facilities, the demand for naphtha and LPG used as base materials is forecast to significantly grow, in turn, to drive an increase in demand for industrial energy
Economic growth scenarios
Total energy demand is predicted to go up by an annual average of 2.6% under the high-growth scenario and an annual average of 2.1% under the low-growth scenario
When establishing the two scenarios, economic uncertainties for the forecast horizon were factored in
GDP assumptions and TPES outlook across three scenarios
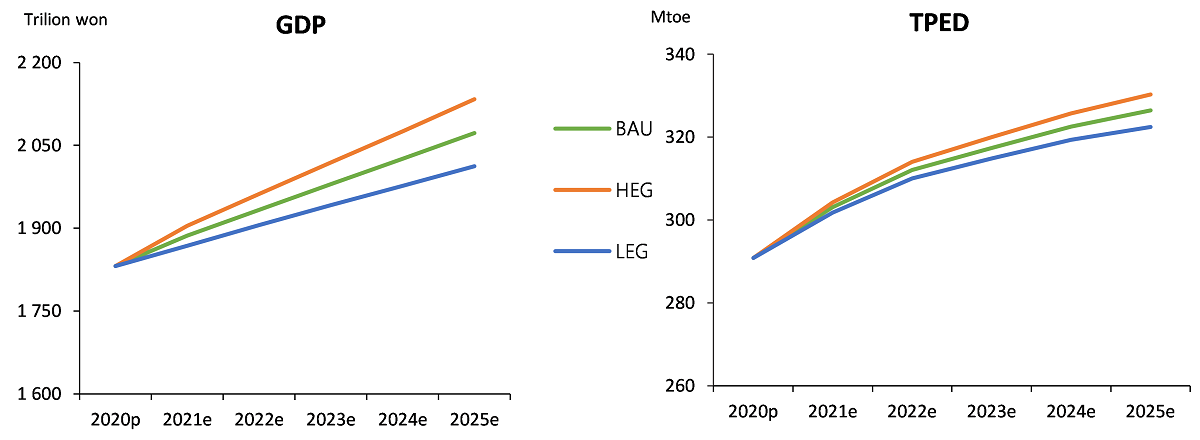
By 2025, TPES is anticipated to reach 330 Mtoe under the high-growth scenario and 323 Mtoe under the low-growth scenario
Under the high-growth scenario, final energy consumption is forecast to grow by an annual average of 2.5% for the period under consideration to reach 250 Mtoe. However, final energy consumption is likely to post an annual average increase of 1.9% to stay around 244 Mtoe under the low-growth scenario
TPES & TFC outlook in 2025 across three scenarios
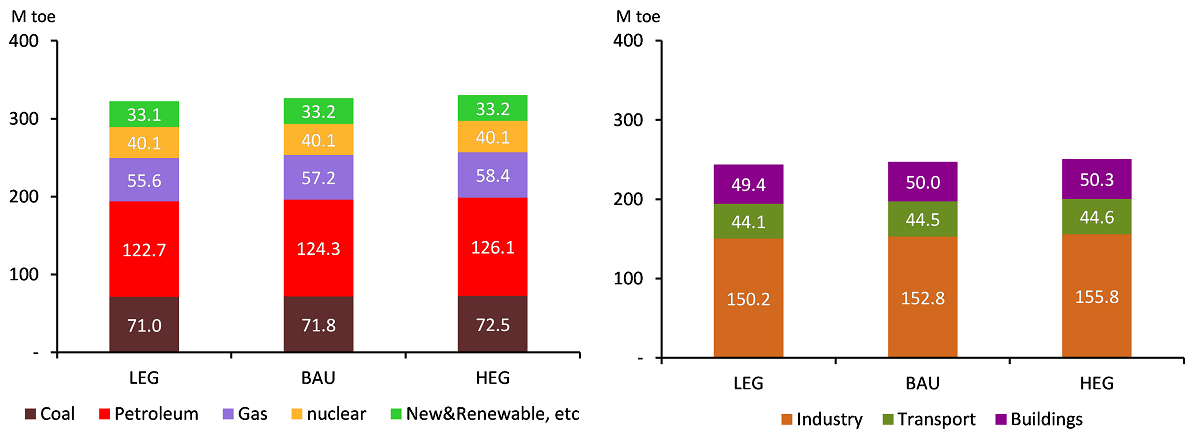
If the high-growth scenario is the case, energy intensity is likely to improve by an annual average of 0.5% to reach 0.158 toe/million KRW while it is anticipated that the index will reach 0.160 toe/million KRW with an annual average increase of 0.2% under the low-growth scenario
Attachments-
KEEI_중기_에너지수요전망(2020~2025)_페이지_001.jpg
Download
-
Mid-term_Energy_Demand_Outlook(2020~2025).pdf
Download
View Details
-
Korea Mid-term Energy Demand Outlook (2019-2024)
- Date2020/08/24
- Author Energy Demand and Supply Research Team
- Number of downloads 19
-
Download multiple files Download the entire file
Total Primary Energy Supply and Total Final Consumption[1]
Total Primary Energy Supply (“TPES”) grew more slowly than in the past, at an annual average rate of 1.4% between 2014 to 2019.
TPES grew by 1.6-2.8% annually between 2014 to 2018, but the average growth rate fell to the mid-1 % level from 2014 to 2019, as it dropped by 1.3% in 2019. Total Final Consumption (“TFC”) rose by 1.2-3.9% annually from 2014 to 2018, but the average growth rate fell to 1.9% from 2014 to 2019, as it fell by 0.6% in 2019. The slower growth of TPES is attributed to the economic slowdown, changing industrial structure and stagnant electricity consumption and etc.
TPES, TFC and GDP growth rates
Feedstock energy use rose by no more than 0.8% on annual average between 2014 to 2019, because coking coal use declined in the iron & steel industry due to business slowdown.
The use of feedstock energy (non-energy oil, coking coal) soared by 5.9% on annual average from 2009 to 2014, led by a strong growth in coking coal use, but the growth rate fell to 0.8% from 2014 to 2019, as coking coal use declined.
Energy (fuel) and non-energy (feedstock) consumption trend
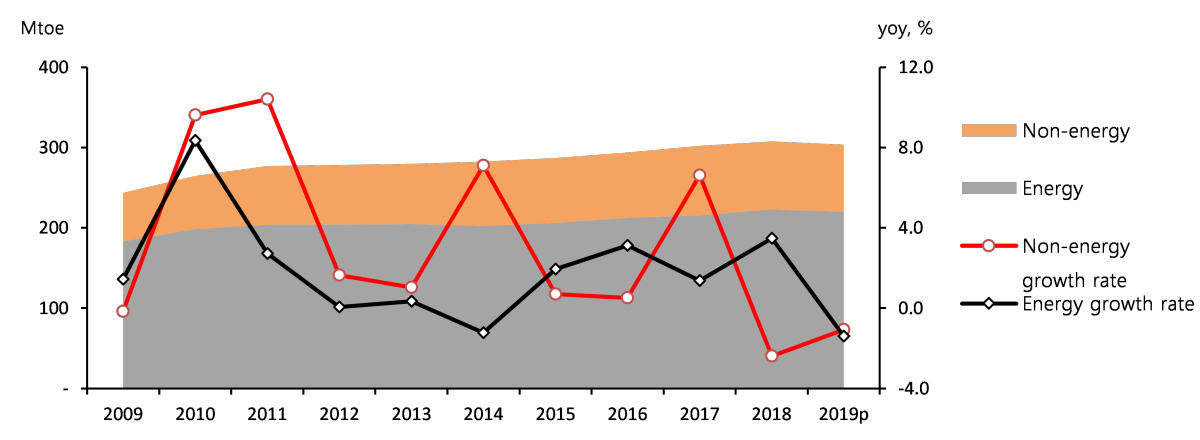
Despite rapidly growing use of LPG as a petrochemical feedstock instead of naphtha, it is not classified in the current energy balance as feedstock energy, which implies that the total use of feedstock energy is statistically underestimated.
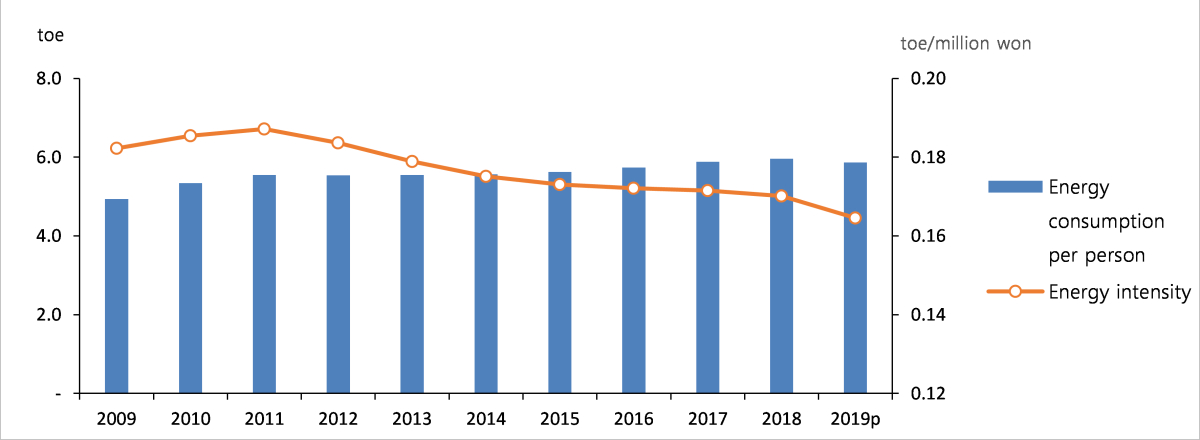
Energy intensity improved rapidly, as energy consumption grew more slowly or decreased.
Energy intensity (toe/KRW1 million), an indicator of energy efficiency, improved rapidly from 2014 to 2019 compared to the previous five-year period (2009-2014). In the case of 2019, a drop in energy consumption was attributed to some factors such as weather conditions rather than energy efficiency, and therefore that year’s energy intensity should not be directly linked to an improvement in energy efficiency.
Per capita energy use and energy intensity trend
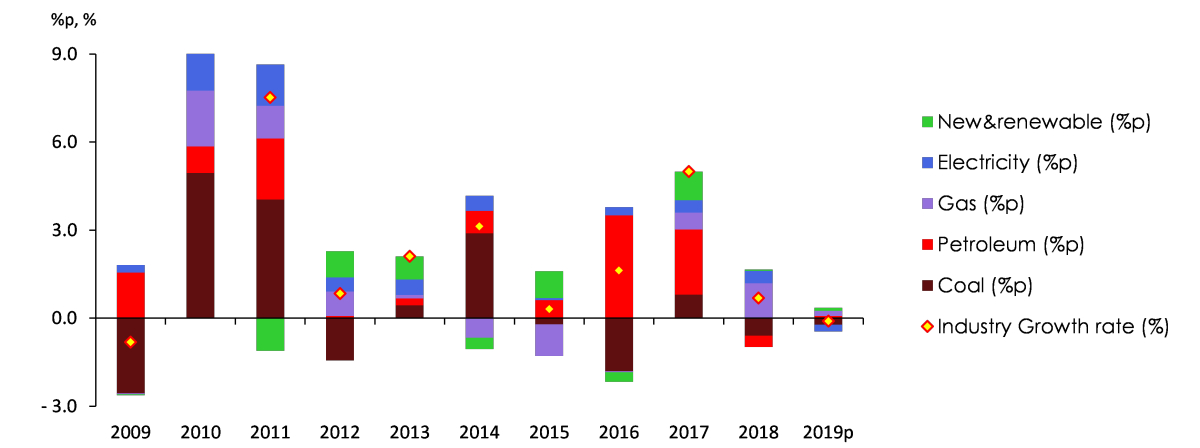
Petroleum and gas use grew decently for the past five years (2014-2019), while coal use remained flat, and the use of nuclear energy declined.
Petroleum use grew at slower rates until the early 2010s due to high oil prices, but it grew at an annual average rate of 2.6% from 2014 to 2019 partly due to the global oil price drop.
TPES growth rates and contribution of energy sources
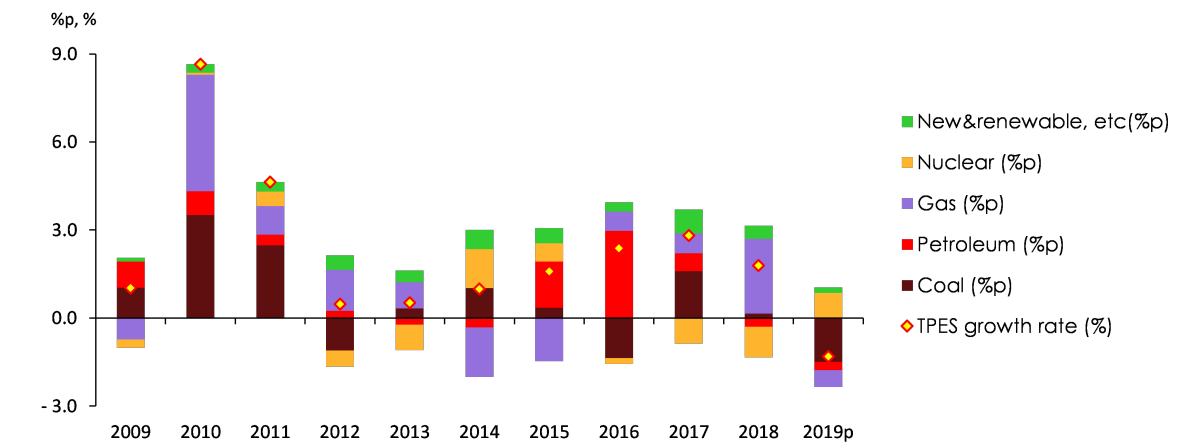
Coal use grew fast until the early 2010s, led by the power generation and steelmaking sectors, but the growth remained stagnant from 2014 to 2019 (0.0%) due to business slowdown in the iron & steel industry and restrictions on coal-fired generation aimed at fine dust reduction.
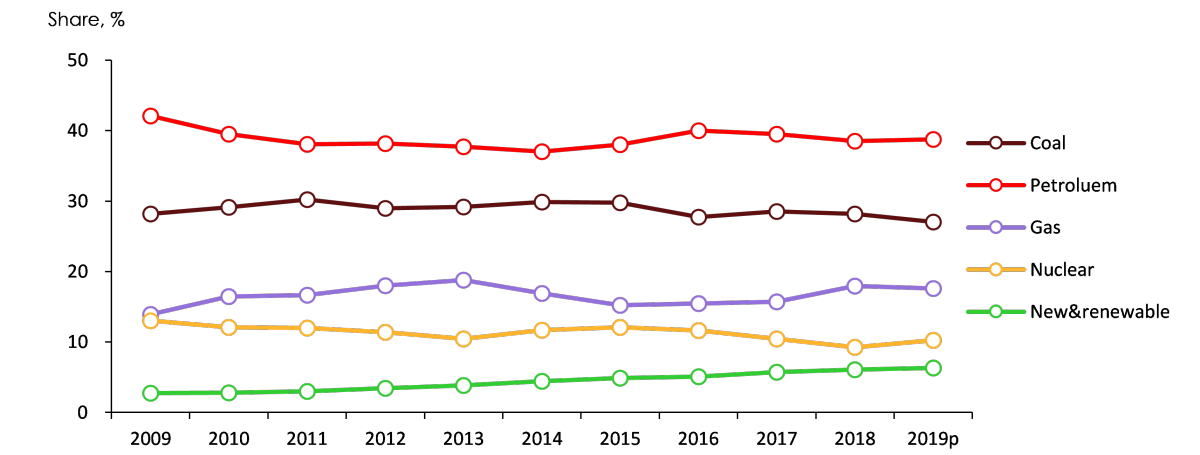
TPES Share by energy sources
Natural gas use rose by 2.2% on annual average from 2014 to 2019, as its use for power generation and district heating grew decently, though it remained flat in the case of city gas production. Nuclear generation dropped by 1.4% on annual average between 2014 to 2019 as a result of the shutdown of two reactors and increased preventive maintenance under the government’s policy of stricter safety inspections, although it increased in 2019 following the commissioning of a new reactor and due to the low base effect of the previous year. Renewable and ‘other’ energy generation rose by 8.8% on annual average from 2014 to 2019 as a result of the government’s support for renewable energy deployment. Electricity use had been growing fast, but it grew at much slower annual rate of 1.7% from 2014 to 2019 due to the economic slowdown and the government policy of demand-side management.
Electricity use and power generation growth rates & contribution of energy sources
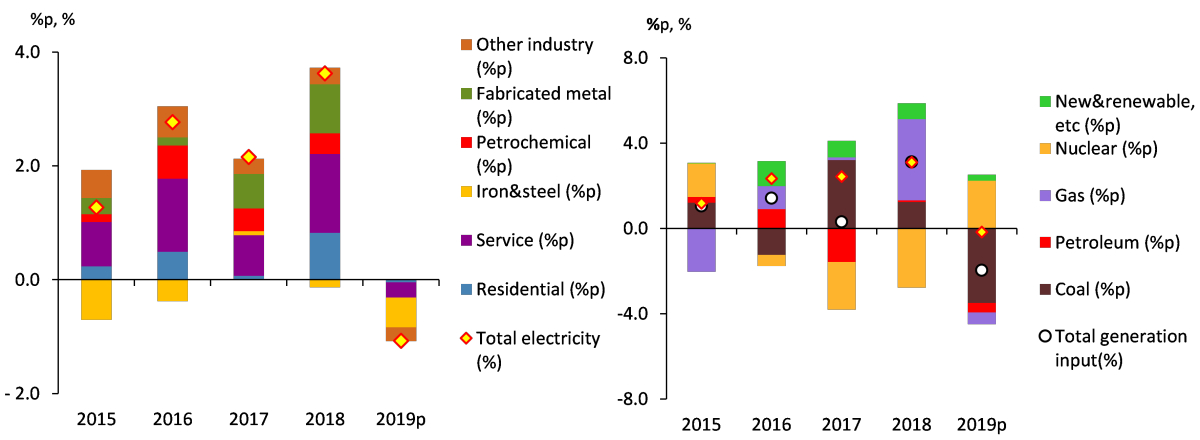
Industrial energy use grew more slowly, while transport and buildings’ energy use grew faster.
Industrial energy use posted an annual average growth rate of 4.7% from 2009 to 2014, led by the iron & steel industry, but it plunged to 1.5% from 2014 to 2019 due to weak iron & steel business.
Industrial energy use growth rates and contribution of energy sources
Transport energy use grew by 2.7% on annual average from 2014 to 2019, which is much faster than the previous five-year period, as it surged between 2015 to 2016 in line with the oil price plunge.
Heating & cooling degree days and buildings’ energy use growth rates & contribution of energy sources
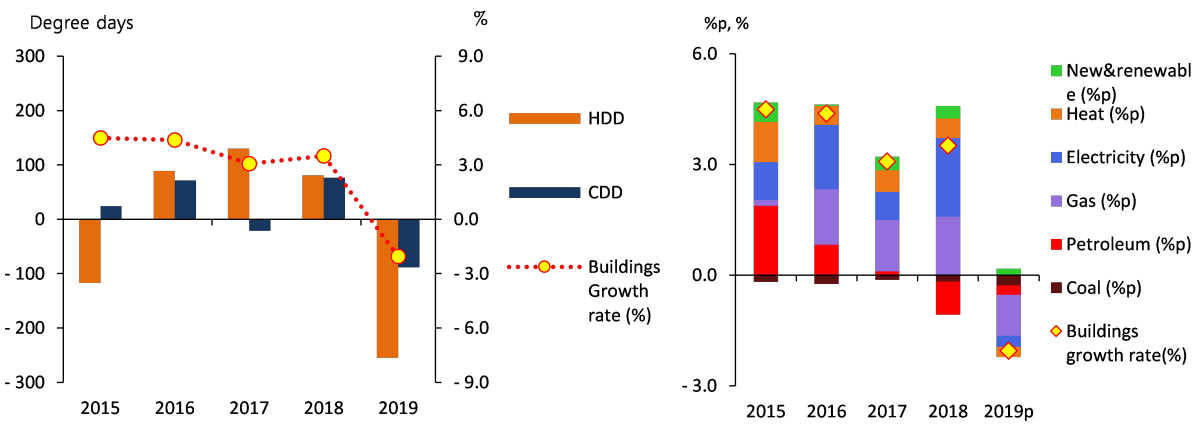
Note: Heating & cooling degree days are compared on a year-on-year basis.
The growth of buildings’ energy use had continuously slowed down due to the stagnant population growth and enhanced energy efficiency, but it grew at faster rate of 2.7% on annual average from 2014 to 2019 affected by abnormal weather conditions such as extreme heat and cold waves.
TPES & TFC Outlook
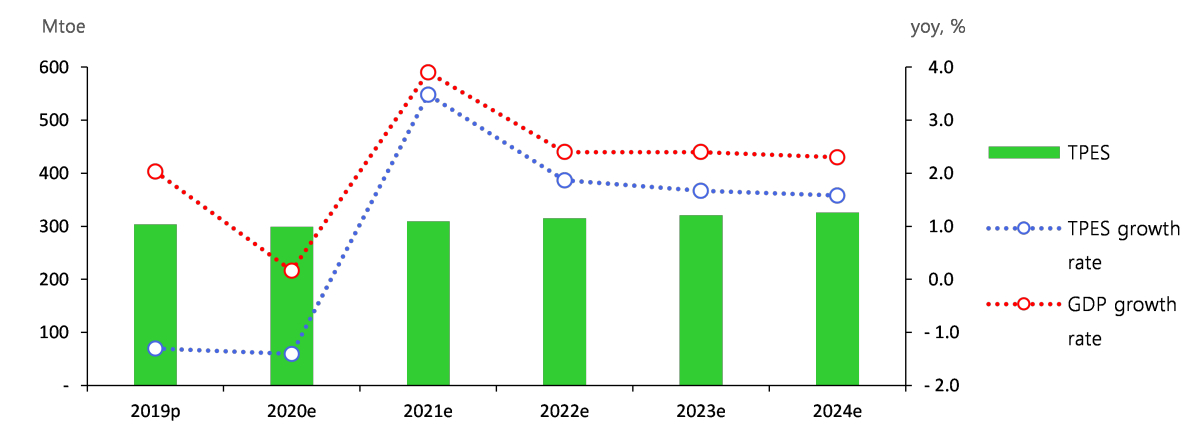
TPES is projected to increase at an annual rate of 1.4% from 2019 to 2024, posting 325.8Mtoe in 2024.
The growth of TPES is likely to fluctuate in a wide range in early years of the outlook period due to the impact of COVID-19, and later the growth will be stabilized at around or over 1.5%.
TPES outlook and TPES, GDP growth rate
Energy intensity will improve steadily, though its pace could be slower than in the past.
Energy intensity (toe/KRW 1 million) declined by an annual average rate of 1.2% from 2014 to 2019, and it will continue to improve during the next outlook period, though the rate is projected to drop to 0.8%. Per capita energy consumption is forecast to grow from 5.9 toe in 2019 to 6.3 toe in 2024, with an annual average rate of 1.4%.
TPES growth rates and contribution of energy sources
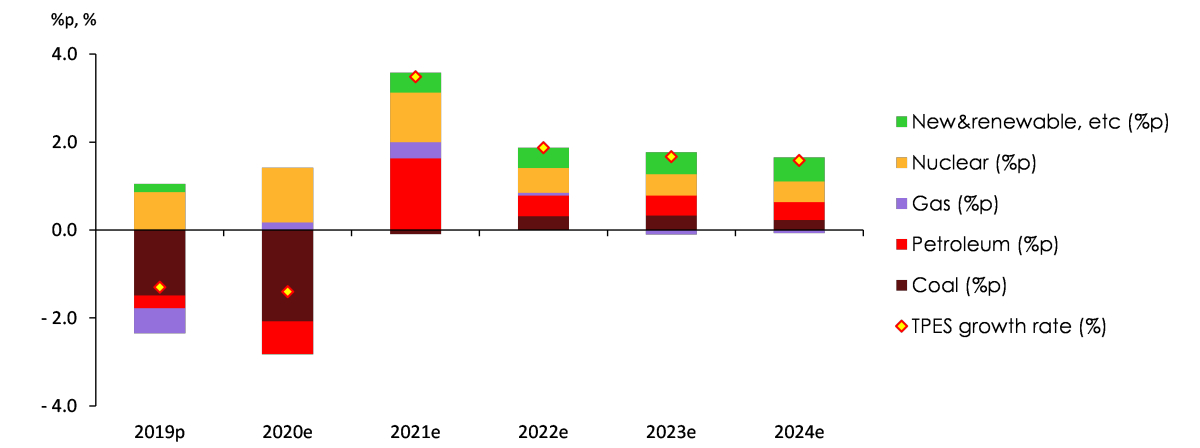
Demand for most energy sources, except nuclear and renewable energy, is expected to grow more slowly than before or decrease.
Petroleum demand is projected to grow at an annual rate of 1.3% during the outlook period, as the demand rebounds in the transport sector from 2021 after it drops sharply in 2020 hit by COVID-19, and as the demand increases in the industrial sector following the construction or expansion of petrochemical facilities. Coal demand is forecast to drop at an annual rate of 0.7% from 2019 to 2024, as its industrial use continues to be stagnant, and the demand drops in the power generation sector despite the commissioning of a new plant, owing to the retirement of old plants and sustained restrictions on coal-fired generation as part of the government’s fine dust reduction efforts.
Growth rates of energy input for electricity generation and contribution of energy sources
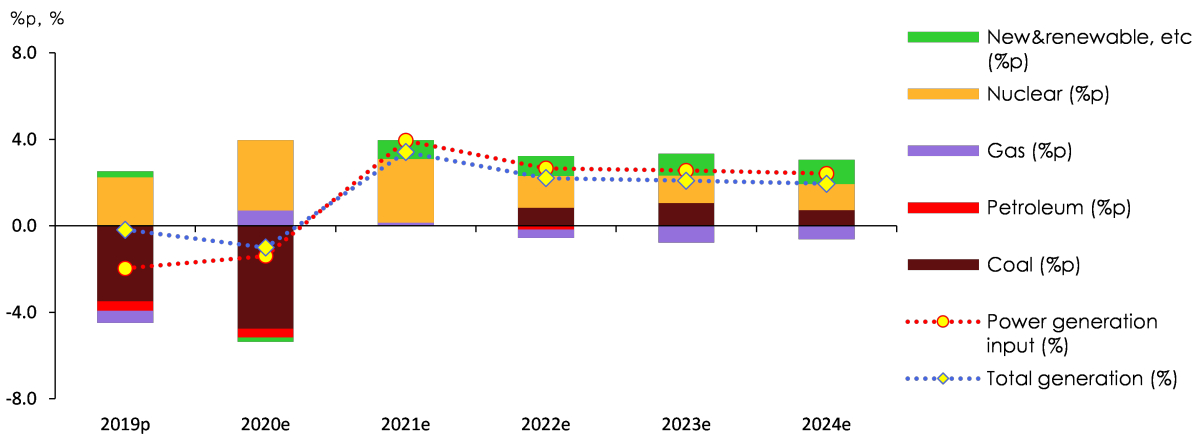
Natural gas demand is likely to grow by mere 0.5% on annual average during the outlook period, even though its demand for city gas production slightly increases, as it declines in the power generation sector partly due to the commissioning of new coal and nuclear power plants. Nuclear generation is forecast to grow fast, at an almost 7% annual rate, during the outlook period, as nuclear capacity factor that was recently extremely low returns to normal level, and a number of new reactors are to be commissioned.
TPES growth outlook by energy sources
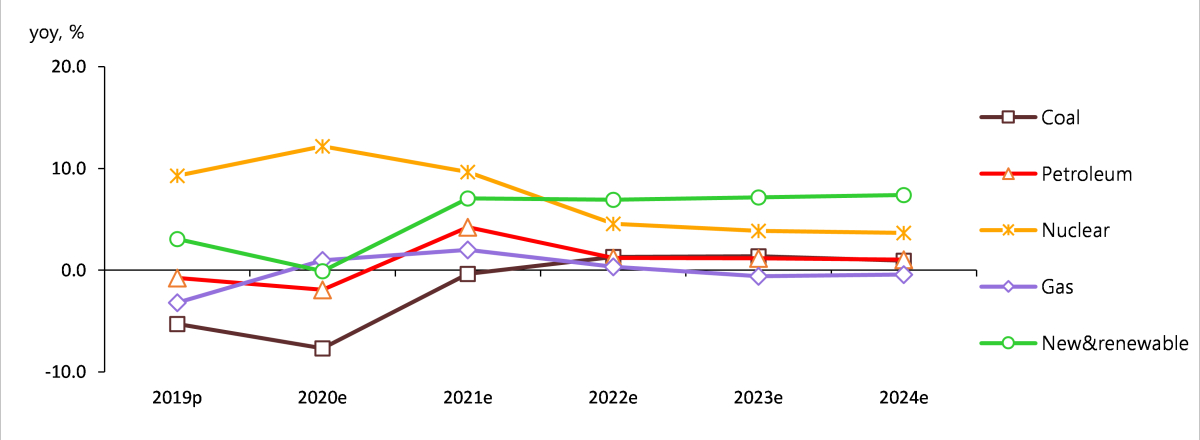
Renewable & ‘other’ energy demand is expected to grow from 19.2 Mtoe in 2019 to 25.3 Mtoe in 2024 at an annual average growth rate of 5.7% supported by the government’s renewable energy development policy. Electricity demand by end-use is forecast to increase by 1.7% on annual average during the outlook period, even though the demand is likely to drop in 2020 due to the impact of COVID-19, as it rapidly rebounds in the following years.
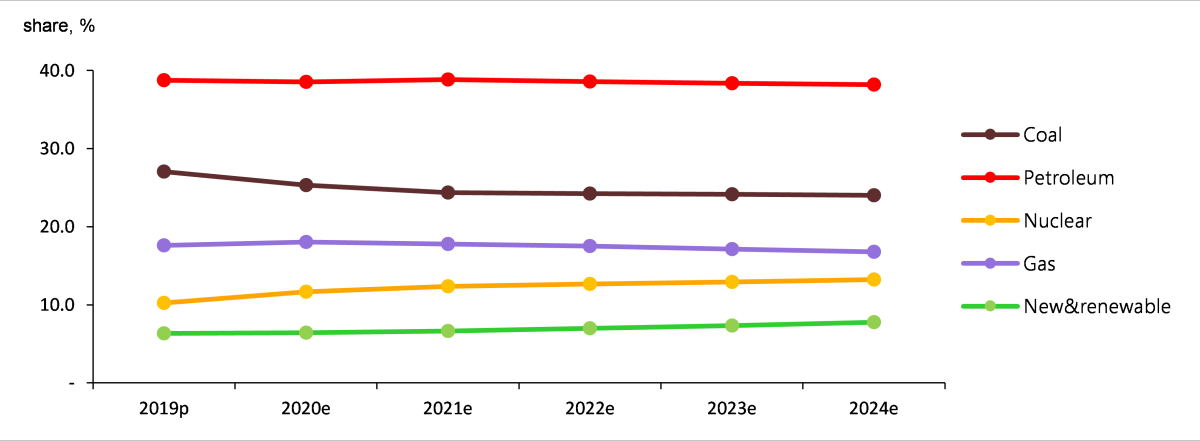
Nuclear and renewable & ‘other’ energy will lead the growth of TPES during the outlook period, accounting for a larger share of TPES.
Petroleum’s share of TPES is expected to slightly decrease, despite growing use of naphtha and LPG as petrochemical feedstock, as it is continuously replaced by alternate energy sources such as natural gas and electricity to fill fuel demand. Still, petroleum will take up the largest share of TPES (38%) in 2024. Coal accounted for 27.0% of TPES in 2019, but the share will shrink to 24% by 2024, as its consumption remains stagnant in the industrial sector and decreases in the power generation sector due to the government’s fine dust reduction measures. Nuclear energy’s share of TPES is expected to grow from 10.2% in 2019 to 13% in 2024, as its capacity factor that was recently at low level slowly recovers during the outlook period, and four new reactors with a total installed capacity of 1.4GW are scheduled for commissioning. Gas share of TPES is expected to drop by around 1%p from 17.6% in 2019 (during the outlook period), as electricity demand comes to a standstill, and its demand declines in the power generation sector with increased share of nuclear energy in total power generation. Renewable & ‘other’ energy’s share of TPES is forecast to expand steadily from 6.3% in 2019 to 8% in 2024 under the government’s renewable energy deployment policy.
TPES share forecast by energy sources
Final energy demand by end-use sector is forecast to increase at an annual average rate of 1.2% during the outlook period, reaching 244.9Mtoe in 2024.
Industrial energy demand is expected to increase, led by the petrochemical and fabricated metals sectors, though its annual growth rate is to be no more than slightly over 1%, as the economic growth stabilizes at low level. Transport energy demand is forecast to grow by mere 0.9% on annual average during the outlook period, as it plunges in 2020, especially in the road transport and aviation sectors, due to the impact of COVID-19 and gradually recovers in the following years. Buildings’ energy demand is projected to grow by slightly over 1% annually during the outlook period, mostly electricity and gas.
TFC growth rates and contribution of end-use sectors
Key Features and Implications
Key features of energy consumption in 2019
TPES dropped in 2019 for the first time since the 1998 financial crisis.[2]
TPES fell by 1.3% year-on-year in 2019 to 303.5Mtoe, despite the 2.0% economic growth. The drop in energy use is attributed to decreased energy demand in buildings due to weather conditions, a sharp decline in bunker-c use in the domestic navigation sector following the International Maritime Organization’s environmental regulation and improved generation efficiency with decreased share of coal-fired generation.
Coal use dropped most sharply among energy sources, followed by gas and petroleum.
Coal use dropped by 5.7% year-on-year in 2019, led by a sharp drop (-7.6%) in the power generation sector owing to the shutdown of some plants after safety issues, limited operation of coal power plants as part of the government’s fine dust reduction efforts and increased planned preventive maintenance, although the pace of decline wasn’t fast in the industrial sector. Natural gas use was down 3.2% year-on-year in 2019, as it declined in the power generation sector due to falling electricity demand, and also affected by decreased city gas use for heating amid decreased number of heating degree days. Petroleum use slid by 0.3% year-on-year in 2019, despite the strong growth in LPG use as industrial feedstock, because the use of naphtha as petrochemical feedstock decreased and bunker-c use plunged as well in the domestic navigation sector.
TPES & TFC growth rates and contribution of energy sources and end-use sectors
Note: The growth rate of TPES (%) = Aggregated total contribution of energy sources (%p), the growth rate of TFC (%) = Aggregated total contribution of end-use sectors (%p)
Nuclear generation posted a year-on-year growth of 9.3% in 2019, as its installed capacity increased with the commissioning of Shinkori unit 4 (Aug. 2019) and the capacity factor also increased after a large number of reactors resumed operation with the completion of planned preventive maintenance. Final use of electricity dropped by 1.1% in 2019 from the previous year, as it declined in both of the industrial and buildings sectors, because the manufacturing production index remained stagnant amid the economic slowdown, and the number of cooling & heating degree days decreased.
TFC dropped by 0.6% year-on-year in 2019, as energy consumption declined in all end-use sectors.
Industrial energy use fell by 0.1% in 2019 from the previous year due to decreased use of electricity and naphtha amid increased maintenance at naphtha cracking centers, despite slightly increased use of bituminous coal for steelmaking in the primary metals sector and growing LPG use in the petrochemical sector. Transport energy use decreased by 0.9% year-on-year in 2019, as bunker-c use plunged in the domestic navigation sector following the environmental regulation by the IMO, even though energy use increased in the road transport sector owing to the decreased petroleum product prices as a result of the global oil price decrease and temporary fuel tax relief. Buildings’ energy use went down by 2.0% year-on-year in 2019, as the number of cooling & heating degree days fell sharply compared to 2018 when extreme weather events—heat and cold waves—were observed.
The COVID-19 crisis and economic uncertainties
The global COVID-19 situation needs to be considered when forecasting the future energy demand, as it is maximizing global economic uncertainties.
The global economic growth was strongly hindered by the COVID-19 pandemic in 1H 2020, as countries around the world imposed nationwide lockdown measures, shut down the borders and enhanced disease prevention efforts, which led to a contraction in production. The COVID-19 spread is expected to be brought under control in the near future with the development of a vaccine or treatment. However, the global economic growth will return in a gradual manner, as there will be repeated outbreaks in each country at different times and the government’s intervention measures have varying levels of success. The pace of economic recovery will differ by region, depending on how far the virus spreads and the success of disease prevention measures.
Changing behaviors and ways of living due to COVID-19 are likely to affect the economic recovery and energy demand growth.
Public concerns over COVID-19 infection is changing their behaviors and ways of living, which could affect the pace of economic recovery, recovery by type of business & sector and structure and level of energy use.
High and low economic growth scenarios
TPES increases at an annual rate of 1.8% under a high economic growth scenario and 0.9% under a low economic growth scenario during the outlook period.
Considering economic uncertainties created by COVID-19 during the outlook period, the high and low growth scenarios were devised. During the outlook period, TPES grows by an annual rate of 1.8% to 331.7Mtoe in 2024 under the high growth scenario and no more than 0.9% to 317.2Mtoe in 2024 under the low growth scenario.
GDP assumptions and TPES outlook across three scenarios
During the outlook period (2019-2024), TFC increases by an annual rate of 1.6% to 250.0Mtoe in 2024 under the high economic growth scenario and remains almost flat with an annual average growth rate of 0.6%, reaching 238.2Mtoe in 2024 under the low economic growth scenario.
TPES & TFC outlook in 2024 across three scenarios
Energy intensity improves by 1.0% on annual average to 0.157(toe/KRW 1 million) in 2024 under the high economic growth scenario and by 0.6% to 0.160 (toe/ KRW 1 million) in 2024 under the low economic growth scenario.
[1]Growth rates of TPES and TFC by energy sources and sectors could be converted to tonnes of oil equivalent, and therefore they could be different from those measured with own unit of energy in (KEEI’s) reports on energy trend and outlook by energy sources.
[2]In 1998, the year of the financial crisis, GDP and TPES fell by 5.5% and 9.5% respectively.
Attachments-
 _2020중기에너지수요전망_표지.png
Download
_2020중기에너지수요전망_표지.png
Download
-
_MidtermEnergyOutlook(2019~2024).pdf
Download
View Details
-
Korea Mid-term Energy Demand Outlook (2017~2022)
- Date2018/10/31
- Author
- Number of downloads 20
-
Download multiple files Download the entire file
Energy Trends
The growth of total primary energy supply (TPES) has slowed down significantly since 2012 then remained at an annual average rate of 1.6% from 2012 through 2017.
TPES marked a relatively high growth rate compared to economic growth rate in the 1990s, however, the growth has been slower than economic growth since the 2000s.
TPES growth from 2010 to 2011 was above economic growth rate, driven by the expanded facilities of the iron & steel and petrochemical industries.
TPES from 2012 to 2013 remained stagnant at around the zero-percent range but then showed a modest pickup and increased to range of 2% in 2017.
The recent TPES growth has become more sluggish compared to economic growth due to the relative growth in the less-energy-intensive industries and decreased energy input for power generation along with falling electricity consumption.
Over the past five years, petroleum consumption has increased while coal consumption plunged and gas and nuclear energy use returned to downward trend.
Petroleum consumption, led by low oil prices and expansion of petrochemical facilities, grew at an annual average rate of 2.5% from 2012 through 2017.
Coal consumption for both steelmaking and generation declined considerably due to the stagnant iron & steel industry and constrained operation of coal-fired power plants, and remained at an annual average rate of 1.7% from 2017 through 2017.
Gas consumption grew rapidly at an average rate of 8% per year from 2007 through 2012 but decreased at an annual average rate of 1.3% from 2012 through 2017, driven by decreased gas use for generation and city gas production.
Nuclear power generation increased from 2014 to 2015 thanks to the introduction of new nuclear power plants, however, the government’s strengthened safety requirements drove it down by an annual average rate of 0.3% from 2012 through 2017.
Electricity consumption went up steadily at an annual average rate of 6.0% from 2000 through 2011 but the growth started slowing down in the 2010s, triggered by sluggish exports and the government’s power-saving policy, and remained at an annual average rate of 1.7% from 2012 through 2017.
The driving force of industrial energy consumption has been weakened recently whereas that of the transport sector has increased thanks to plummeting oil prices.
Energy consumption for industrial use, mainly driven by the petrochemical industry, increased at an annual average rate of 2.3% from 2012 through 2017. However, with the sluggish primary metal industry, the growth slowed down dramatically compared to the past which is attributable to economic slowdown, a sharp decrease in exports to China, etc.
The growth of energy use in the transport sector displayed a drastic decline in 2017. However, for the past five years (2012-2017), it has grown faster at an annual average rate of 3.0% thanks to consumption surge triggered by the oil price plunge of 2015-2016.
Energy consumption growth in the buildings sector, continuing its downward movement led by stagnant population, improved energy efficiency, etc., increased at an annual average rate of 1.4% from 2012 through 2017.
Energy Outlook
Total primary energy demand (TPED) is expected to rise at an annual average rate of 1.9% from 2017 through 2022 and reach 330.3Mtoe in 2022.
Taking into account consumption recovery for industrial use during the forecast period (2017-2022), TPED growth is anticipated to be higher than that over the last five years.
However, annual TPED growth is expected to be somewhat different from economic growth rate due to temperature effect, expansion of petrochemical facilities, etc.
During the forecast period, TPED is projected to grow more rapidly compared to the period of 2012-2017, thanks to the moderate recovery of the iron & steel industry, expansion of petrochemical facilities, increasing semiconductor exports, etc.
Energy intensity growth will slow down compared to the last five-year-period whereas energy consumption per capita is expected to grow faster.
Energy intensity is anticipated to rise from 0.194 in 2017 to 0.184 in 2022 and energy consumption per capita will increase from 5.9 toe in 2017 to 6.3 toe in 2022, at an annual average rate of 1.0% and 1.5%, respectively.
The growth of petroleum and coal demand are expected to slow down compared to the past while the use of gas and nuclear energy will grow and rebound during the forecast period (2017-2022).
Petroleum (↑at an annual average rate of 1.3%) Taking into account that international oil prices are expected to show a slight uptick, the annual average growth rate of this forecast period is anticipated to slow down compared to the past five years (2012-2017)
Coal (↑1.2%) Amid increasingly sluggish coal demand for power generation driven by the government’s policy to restrain operation of coal-fired power plants, the growth of bituminous coal demand for steelmaking (coking coal) will slow down compared to the past five years due to the modest recovery of the iron & steel industry.
Gas (↑1.1%) While gas demand for generation is likely to make a turnaround from negative growth and remain unchanged, that for city gas production, led by industrial city gas use, is projected to rise and rebound
Electricity (↑2.5%) Electricity demand growth is forecasted to grow further compared to the last five years (1.7% per year on average) but remain at an annual average rate of below 3% which is lower than that of the pre-2010 period, due to changes in industrial structure, efficiency improvement, etc.
Total final energy demand (TFD) will expand at an annual average rate of 1.9% throughout the forecast period and reach 255.2Mtoe in 2022.
Industry (↑2.3%) Along with the rising economic growth, energy demand for industrial use is projected to grow, mainly driven by the petrochemical industry, at an annual average rate of 2% or higher, and lead TFD.
Transport (↑1.0%) Energy demand in the transport sector will grow slower due to gradual increase of oil prices and its annual average growth rate will remain at around 1% from 2017 through 2022.
Buildings (↑1.4%) The annual growth rate of energy demand in the buildings sector will continue to remain at the 1% range on average, led by electricity and gas demand.
Key Features and Implications
Energy demand in the industrial sector is predicted to show different trends compared to changes in economic growth due to changes in petroleum demand in the petrochemical industry.
Demand for naphtha and industrial LPG will increase by 8.5Mtoe during the forecast period (2017-2022) and account for nearly 50% of the increase of energy demand in the industrial sector.
The growth of energy demand for industrial use from 2020 to 2021 will take different paths from economic growth rate due to changes in naphtha and LPG demand driven by expansion of petrochemical facilities.
Changes in power generation facilities and their share prompted by the government’s energy transition policy will increase power generation efficiency and slow down greenhouse gas growth.
Generation capacity, driven by renewable/other, nuclear and coal-fired power plants, is expected to expand according to the 8th Basic Plan on Electricity Demand and Supply.
Gross electricity generation is anticipated to increase at an annual average rate of 2.4% throughout the forecast period, driven by nuclear and coal-fired generation, and reach 624TWh in 2022.
The increasing share of gas power plants is likely to improve generation efficiency which is expected to slow down the growth of energy input for power generation and TPED.
The growth of greenhouse gas emissions from the power generation sector during the forecast period is predicted to be lower than that of gross electricity generation, taking into account the decreasing share of coal-fired power plants.
The contribution level of petroleum and coals which lead TPED and that of the industrial and transport sectors that drive total final consumption (TFC) will show a downward movement.
The driving force of petroleum and coals for energy consumption will fall while nuclear energy, petroleum, renewable/other energy and coal are expected to contribute to TPED at similar levels.
In terms of energy demand by sector, demand in the industrial and transport sectors will slow down, driving down the growth rate of TFD.
Considering economic uncertainty, TPED and TFD are anticipated to increase at an annual average rate of 1.5-1.9% and 1.6-2.3%, respectively, during the forecast period.
Economic growth rate in the high-growth and low-growth scenarios are calculated by applying ±1.0%p to the standard rate of 2.9% (an annual average rate).
Throughout the forecast period, TPED in the high-growth and low-growth scenarios will grow at an annual average rate of 2.3% to 337.5Mtoe in 2022 and 1.5% to 324.7Mtoe in 2022, respectively.
Throughout the forecast period, TFD in the high-growth and low-growth scenarios are expected to rise at an annual average rate of 2.3% to 260.0Mtoe in 2022 and 1.6% to 251.1Mtoe in 2022, respectively.
Energy intensity in the high-growth and low-growth scenarios are projected to increase at an annual average rate of 1.4% to 0.180(toe/mil won) in 2022 and 0.4% to 0.190(toe/mil won) in 2022, respectively.
Attachments-
KoreaEnergyOutlook_2018_MID.pdf
Download
View Details
-
T_중기.png
Download